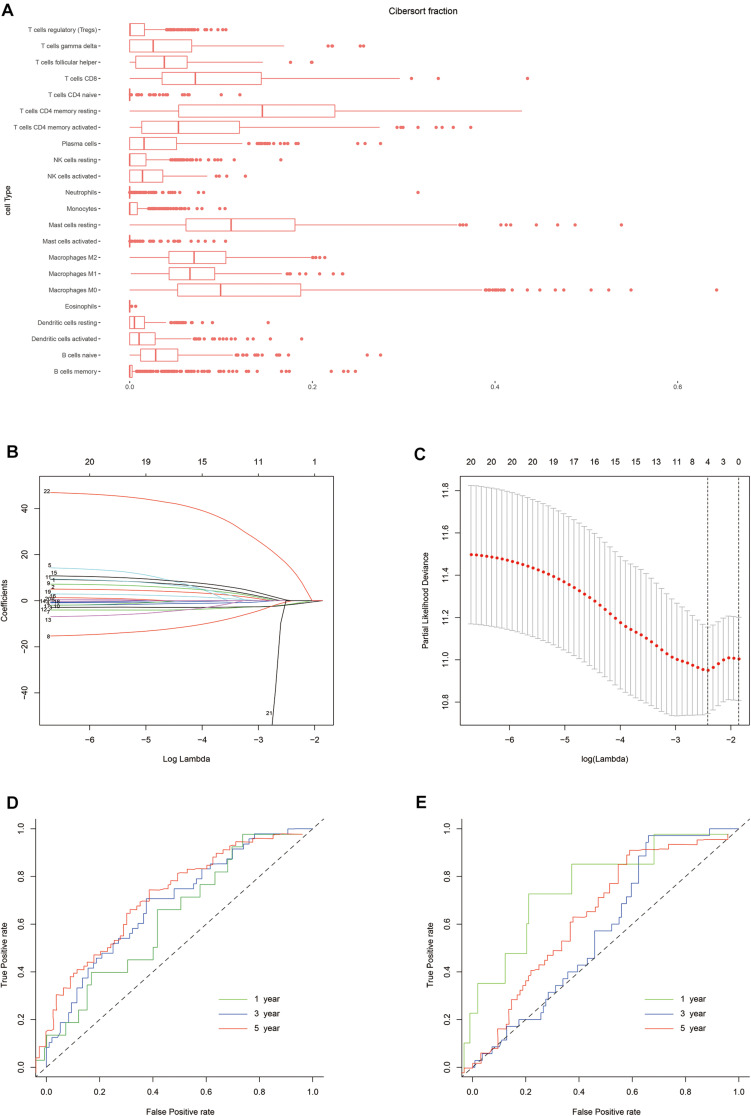
FIGURE 2.
Construction of the risk model. (A) Box plot showing the proportions of 21 immune cell types across 288 samples filtered by CIBERSORT. (B) LASSO regression coefficients of the 21 immune cell types. The dotted line indicates the value chosen by tenfold cross-validation. (C) Tenfold cross-validation informing the parameter selection in the LASSO model. (D,E) Risk score determined by time-dependent receiver operating characteristic (ROC) curves for the training and testing cohorts. The area under the ROC curve was 0.600, 0.691, and 0.716 for the risk scores for 1-, 3-, and 5-year overall survival (OS) in the training cohort, versus 0.800, 0.580, and 0.632 in the testing cohort, respectively.

