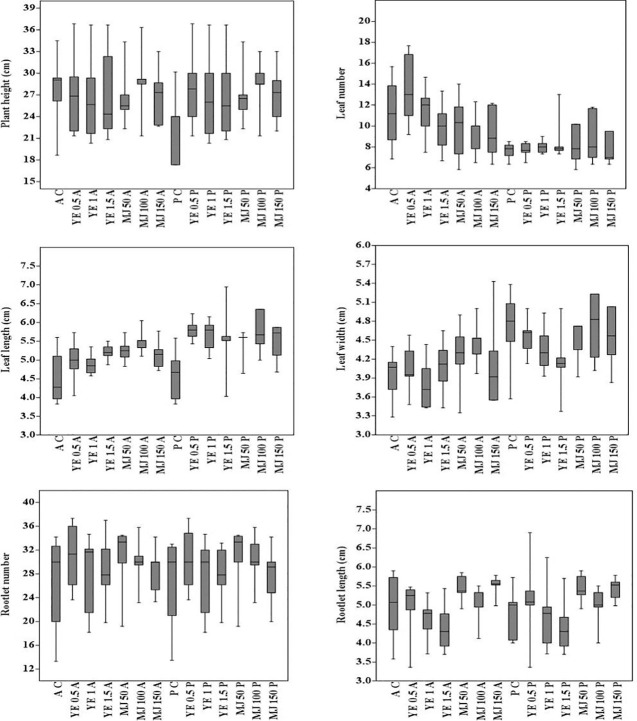
Figure 3.
Box plot analysis (means and 0.95 confidence intervals), showing the minimum, first quartile, median, third quartile and maximum values for comparison of morphological characters of plants cultivated under different systems [AC, aeroponic control; A, aeroponic; YE, yeast extract (0.5, 1 and 1.5 mg/L); MJ, methyl jasmonate (50, 100, and 150µM); PC, pot control; P, pot]. To interpret variation coefficient of variation (CV) was calculated using formula [CV % = (standard deviation/mean) × 100].

