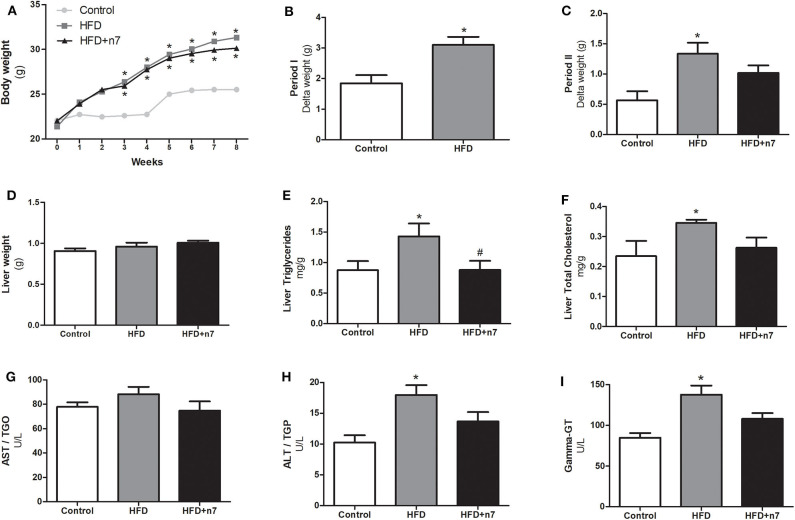
Figure 1.
Weight gain curve (A), Body mass gain in period I (B) and II (C), liver mass (D), hepatic triglyceride in mg/g of liver weight (E), total hepatic cholesterol in mg/g of liver weight (F), AST (G), ALT (H), and γ-GT (I) levels in U/L in plasma. In period I (weeks 1–4), the animals received control or high-fat diet (HFD). In period II (weeks 4–8), the diets were maintained, and the animals received either water (control and HFD groups) or palmitoleic acid (HFD+n7 group) by oral gavage. Results were expressed as mean ± SEM (n = 12). Data were analyzed by one-way ANOVA. *p < 0.05 vs. control, #p < 0.05 vs. obese.

