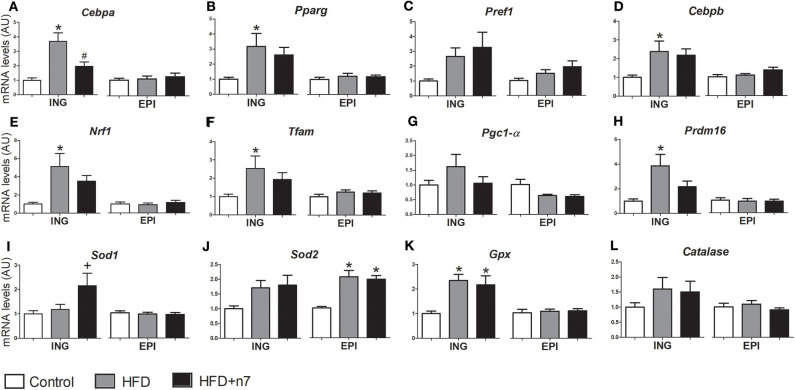
Figure 4.
mRNA levels of Cebpa (A), Pparg (B), Pref1 (C), Cebpb (D), Nrf1 (E), Tfam (F), Pgc1-α (G), Prdm16 (H), Sod1 (I), Sod2 (J), Gpx (K), and Catalase (L) expressed by isolated adipocytes from ING and EPI fat depots in arbitrary units (AU), normalized by Gapdh. Results were expressed as mean ± SEM (n = 12). Data were analyzed by one-way ANOVA. *p < 0.05 vs. control, #p < 0.05 vs. obese, +p = 0.05 vs. all groups.

