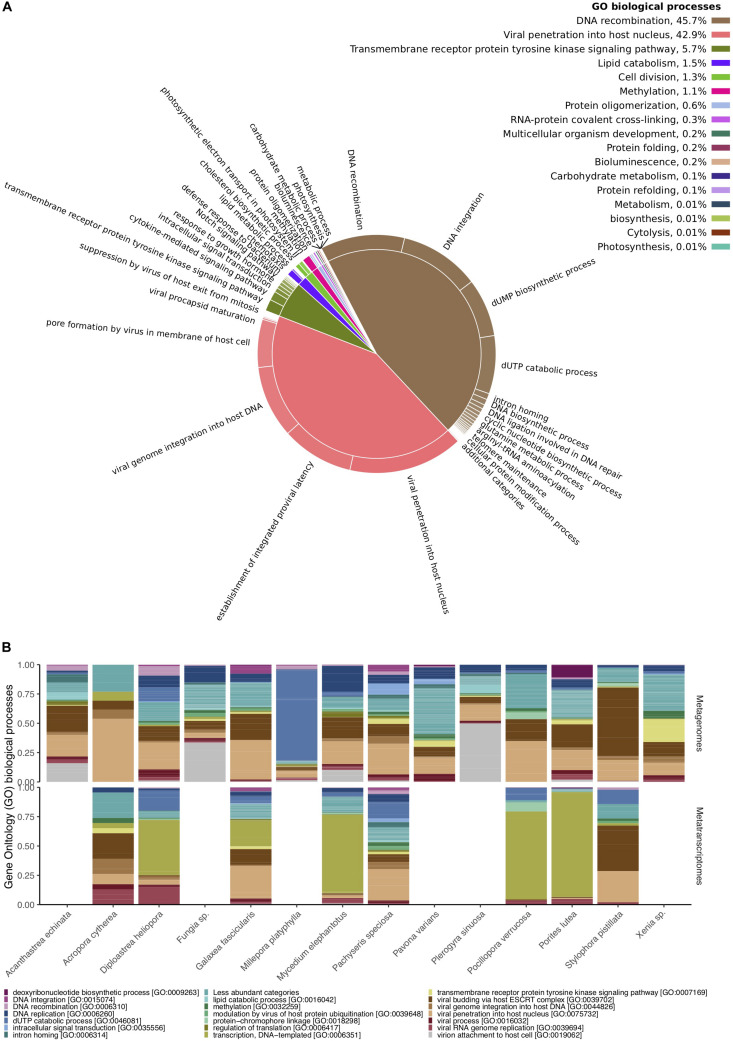
FIGURE 3.
Functional diversity of Red Sea coral-associated viruses. (A) Gene Ontology (GO) enriched biological processes in a two-level hierarchical structure. Contribution of higher order processes provided in percent at the top right; relative contribution of lower order provided in form of a pie chart. (B) Relative abundances of the 20 most abundant GO biological processes annotated to viral sequences across cnidarian metagenomes (top) and metatranscriptomes (bottom).

