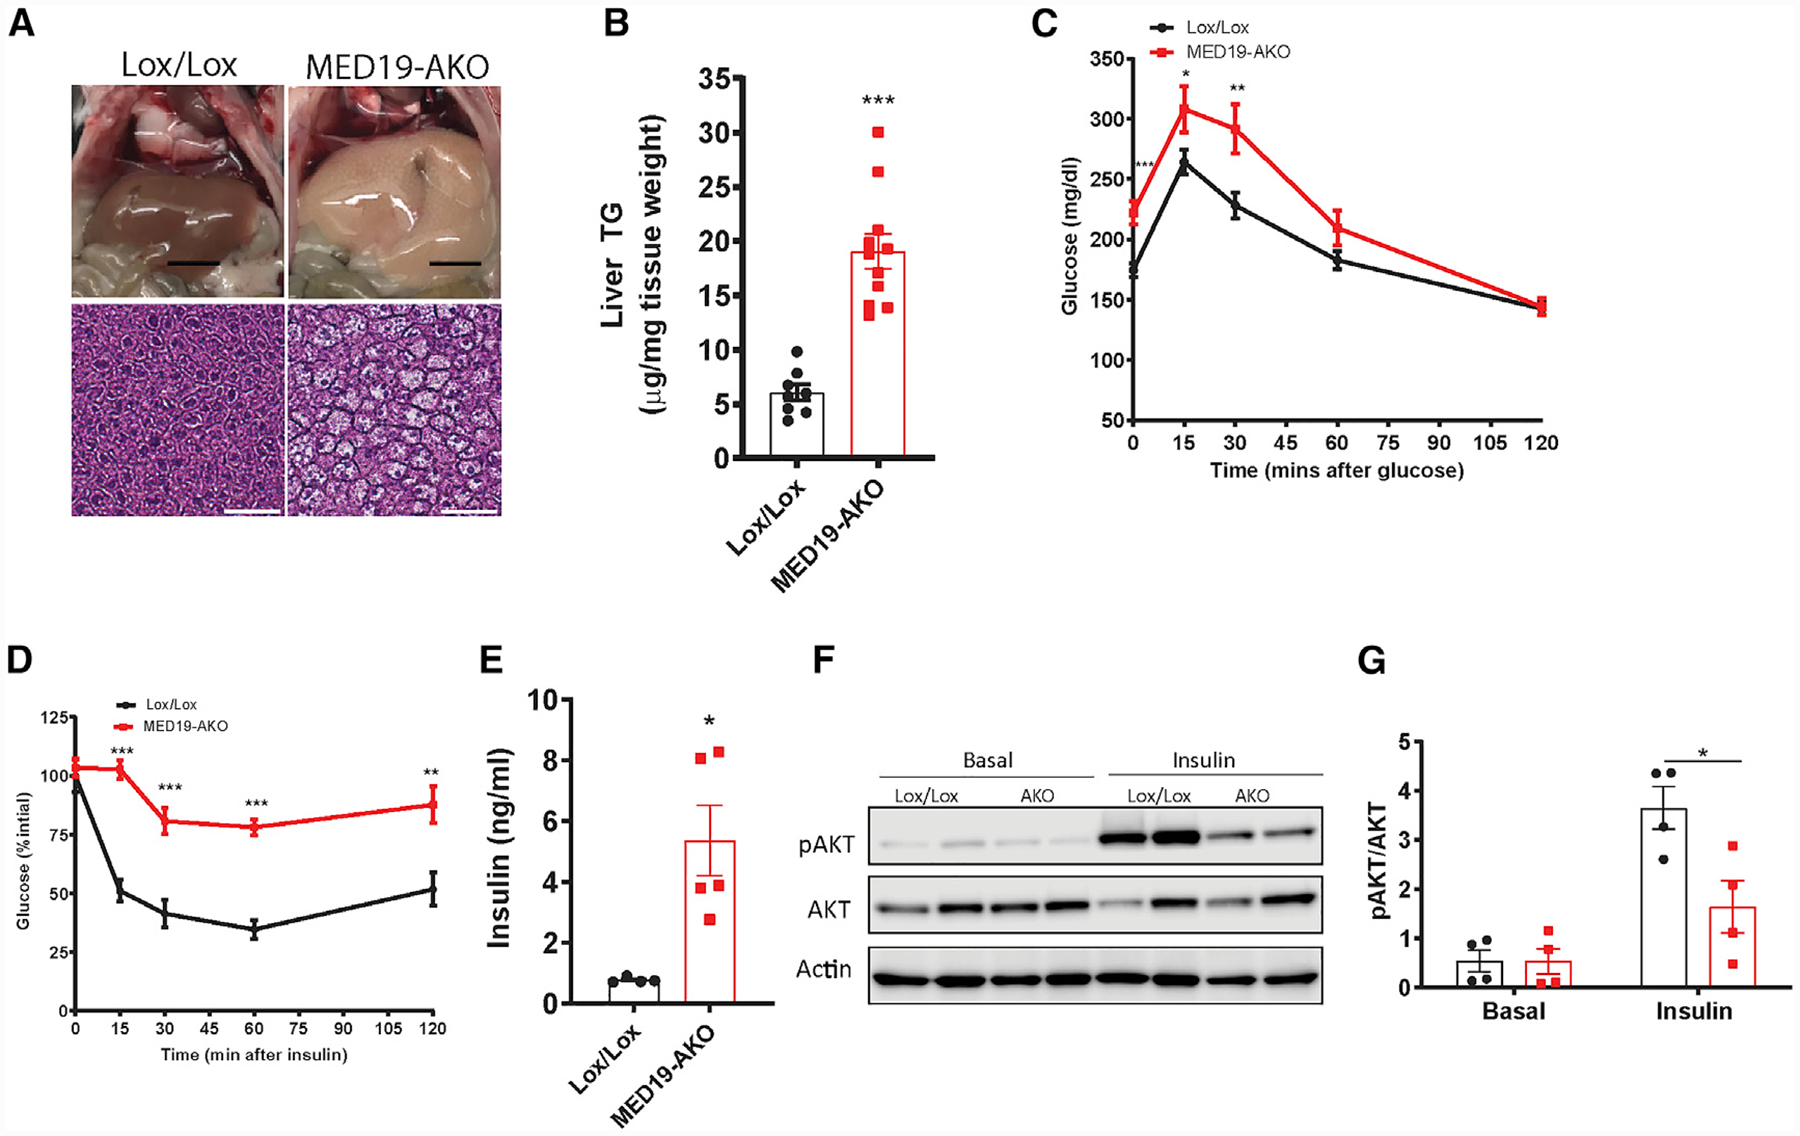
Figure 2. MED19-AKO Mice Have Fatty Liver and Insulin Resistance.

(A) Gross and histological images of H&E-stained liver. Scale bars represent 0.5 cm (gross liver images) and 75 μm (liver histology).
(B) Liver triglyceride content; n = 8 Lox/Lox mice and n = 11 MED19-AKO mice.
(C) Glucose tolerance test; n = 20 Lox/Lox mice and n = 13 MED19-AKO mice.
(D) Insulin tolerance test; n = 7 each.
(E) Serum insulin ELISA; n = 4 Lox/Lox mice and n = 5 MED19-AKO mice.
(F) Western blot analysis of Akt phosphorylation in livers of MED19-AKO and control mice at baseline and 10 min following insulin injection.
(G) Quantification of the results in (F); n = 4 each.
*p < 0.05, **p < 0.005, and ***p < 0.0005. For all panels, the error bars represent the SEM. See also Figure S2.
