Fig. 3.
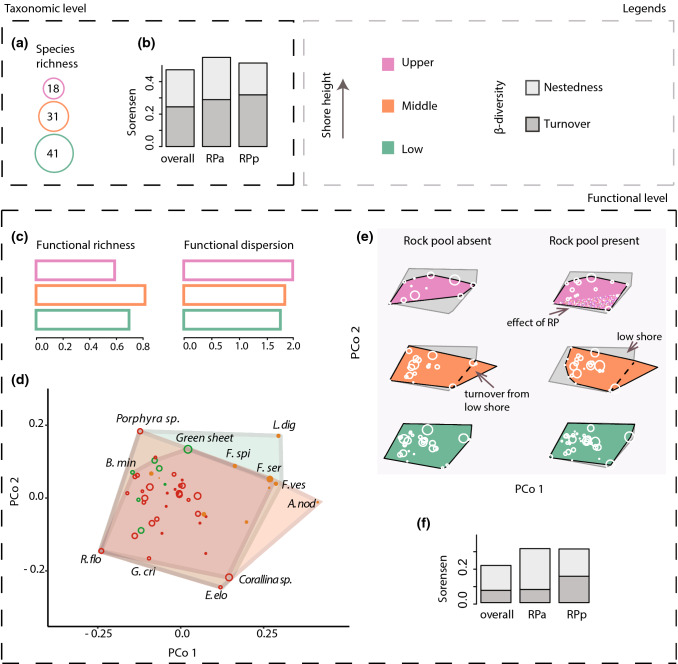
Seaweed functional ⍺- and β-diversity across intertidal zones (large scale), separated between the taxonomic and functional level. Panels a–b show species richness across zones and taxonomic β-diversity (divided into nestedness and turnover; for all communities and those with and without rock pools—RP). Panel c shows indices of functional richness (scaled to the potential maximum; details in Methods) and functional dispersion at each zone (all quadrats together). Panel d contains a representation of the two-dimensional trait space of the species pool (n = 50; PCoA biplot), indicating the zones with a coloured polygon. Species abbreviations are shown for those at the edges of the trait space at each height (complete names are given in Fig. 4). Panel e shows the same functional space, but separately for each zone and habitat type. Circle sizes on d represent five frequency categories (< 10, < 20, < 30, < 40 and < 50), with circle colours referring to the algae group (brown algae: filled orange, green algae: hollow green, and red algae: hollow red); circle sizes on e are proportional to species local frequency. Nestedness is observed when a polygon is inside a larger one (represented in grey on panel e), while turnover is an expansion of a polygon (indicated in dashed line). Although we did not address β-diversity between habitats, we indicate the addition to the functional space with the presence of rock pools at the upper shore (pixelated pink). Barplots in panel f show the partition of functional β-diversity components, overall and for the two habitat categories

