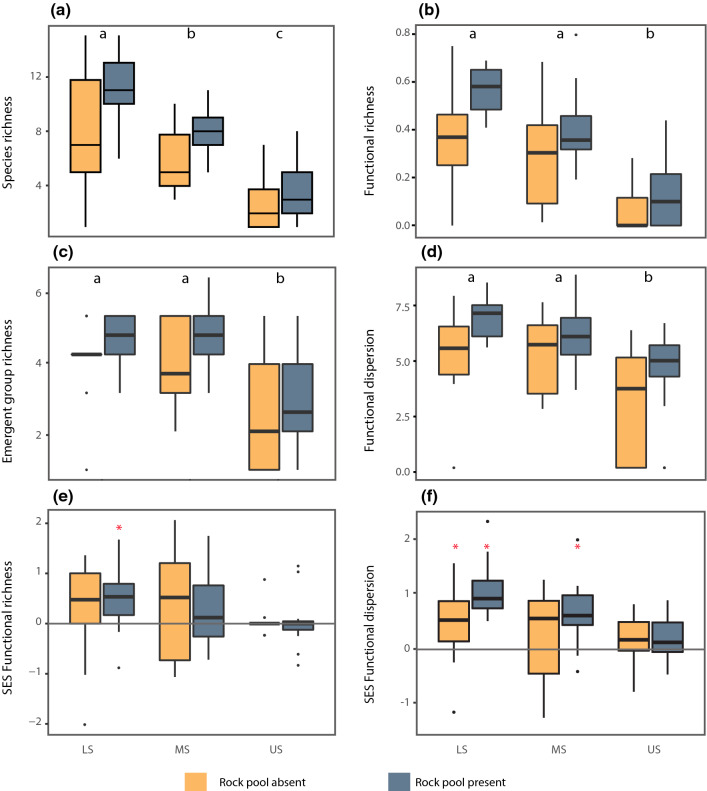
Fig. 5.
Observed and SES values of species’ and functional α-diversity. Boxplots show values across-shore zones (LS low shore, MS middle shore, and US upper shore), in quadrats with and without rock pools. Functional richness is scaled to the potential maximum (details in Methods). For observed values, different letters on top of boxes indicate zones are significantly different. For SES, values above or below the lines indicate deviance from null models, i.e. greater or lower than expected at random (asterisks indicate the significance of difference, obtained from one-sample t test, or Wilcoxon rank test when data distribution was not normal). Constrained randomizations are given in Fig. S6; SES without the zone-defining Phaeophytes are given in Fig. S1

