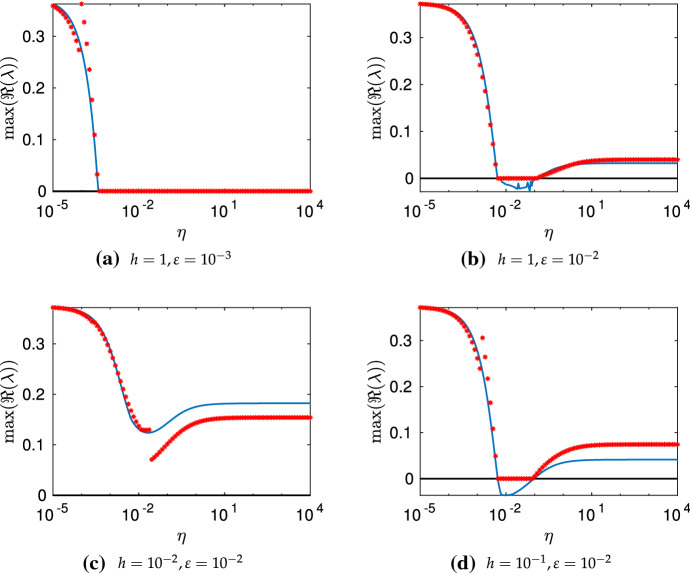
Fig. 3.
Non-trivial dependency of Turing instabilities on geometric parameters. Plots of given by Eq. (28) in blue computed across 250 values of for different parameter combinations, and plots of given by (46) in red asterisks for 100 values of . The other parameters were taken as , , , , . The constant c in was fixed per set of parameters/panel to match the maxima of and across to qualitatively compare these metrics. The parameter sets corresponding to and gave qualitatively the same results as in panel (c) with for all (Color figure online)

