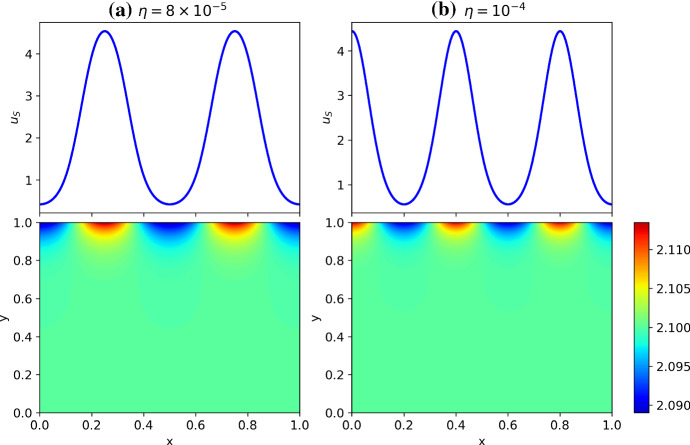
Fig. 4.
One-dimensional plots of corresponding to parameters in Fig. 3a for two values of in the top two panels, and plots of the corresponding below (with in all cases). The surface concentration is effectively homogeneous in the y direction, and so is essentially a one-dimensional pattern, shown above. Note that the bulk concentrations are almost homogeneous, whereas the surface concentrations are not (compare the scales of and ) (Color figure online)

