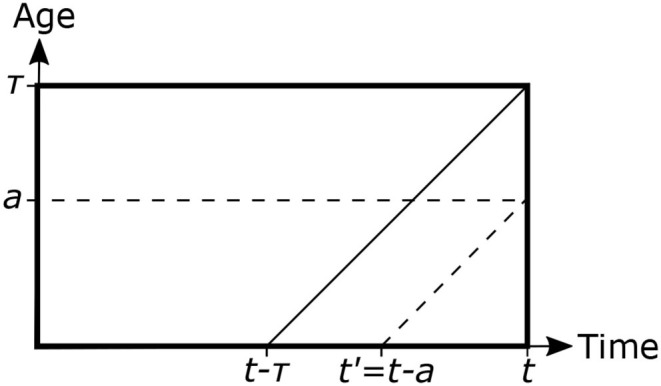
Figure 5.

Scheme representing the age structure of a population of infected mammalian cells. τ represents the age at which infected cells are lysed and liberated the incubated parasites to the environment. Inclined lines are the characteristics of the partial differential equation governing the system dynamics, and indicate how the solution at any (t, a) point can be traced back to the a = 0 axis.
