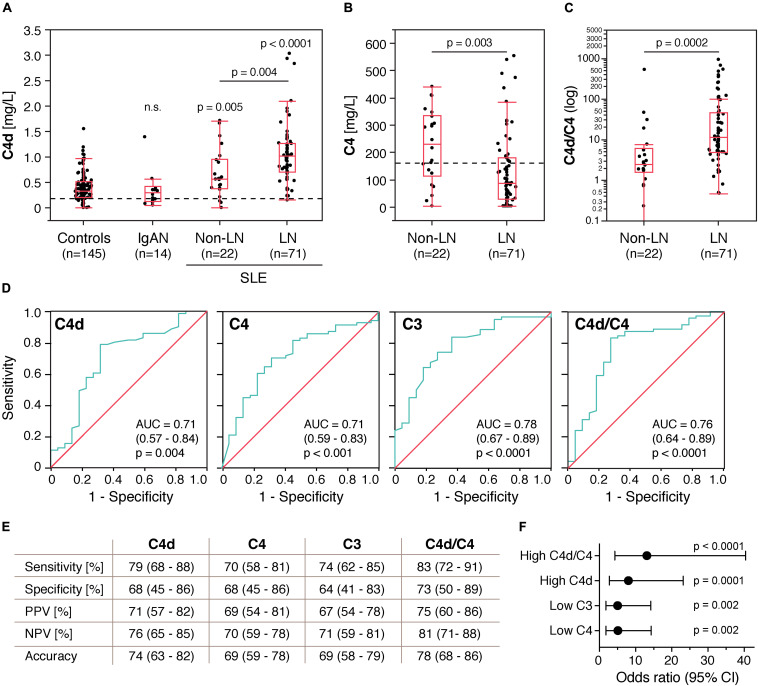
FIGURE 1.
Plasma C4d levels are increased in patients with systemic lupus erythematosus (SLE) and discriminate lupus nephritis (LN) from non-renal SLE patients. (A) C4d levels in control subjects, IgA nephropathy patients (IgAN) and SLE patients without and with lupus nephritis. (B,C) C4 levels and C4d/C4 ratio in non-renal SLE patients and LN patients. Data are presented as medians with 25–75% quantiles plus whiskers, and significance was calculated using Kruskal-Wallis rank-sum and Mann–Whitney U tests. The C4d/C4 ratio for one of the non-renal SLE patients is zero and can thus not be displayed on a logarithmic scale. Dotted lines indicate the upper normal reference range for C4d (0.15 mg/L) and the lower normal reference range for C4 (160 mg/L). (D) Area under the ROC curve analysis showing accuracy of C4d, C3, C4, and C4d/C4 ratio as markers for LN. (E) Sensitivity, specificity, positive predictive value (PPV), negative predictive value (NPV) and overall accuracy for C4d, C3, C4, and C4d/C4 ratio as markers for LN. The disease prevalence was set to 50%. Data are presented with 95% CIs. (F) Association of high C4d (>0.67 mg/L), low C3 (<0.77 g/L), low C4 (<154 mg/L) and high C4d/C4 ratios (>4.19) with LN. Significance was calculated using binary logistics, and ORs are indicated with a dot connected to the 95% CI.

