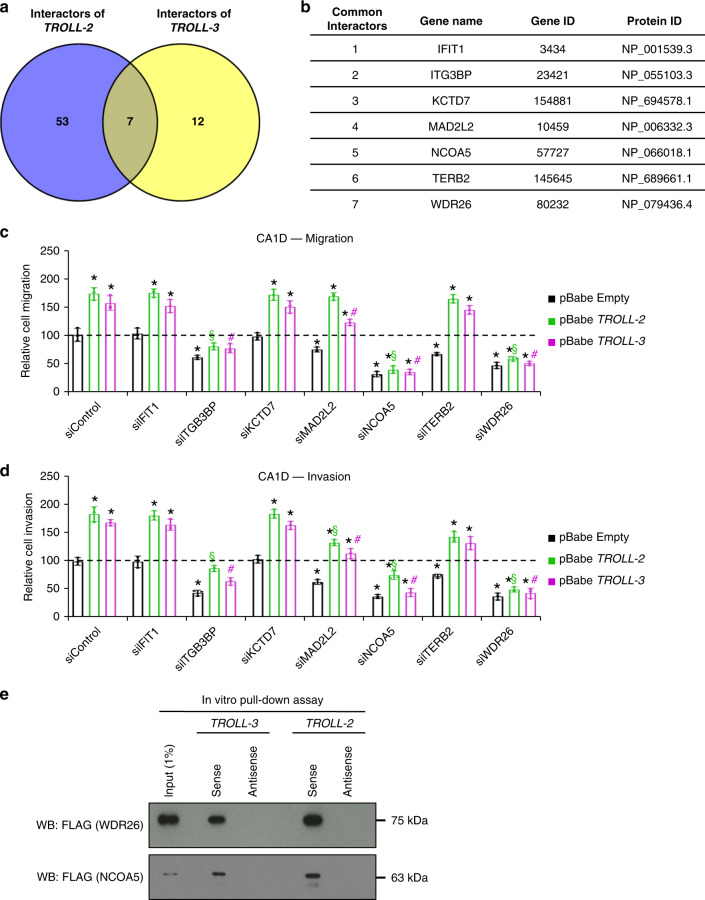
Fig. 3. TROLL-2 and TROLL-3 promote cancer progression via WDR26.
a Venn diagram of the proteins interacting with TROLL-2 and TROLL-3. b Table listing the 7 common interactors of TROLL-2 and TROLL-3. c, d Quantification of cell migration (c) and invasion (d) of CA1D cells overexpressing either TROLL-2, TROLL-3, or the empty vector, and transfected with the indicated siRNAs. Graphs represent the individual data points, mean ± SD and analysed with two-tailed Student’s t test, n = 3 biological replicates, asterisk vs. pBabe Empty siControl, P < 0.005. Section vs. pBabe TROLL-2 siControl, P < 0.005. Hash vs. pBabe TROLL-3 siControl, P < 0.005. e Representative western blot for the indicated proteins pulled down by the indicated lncRNAs. n = 3 biological replicates. Source data are provided as Source data file.

