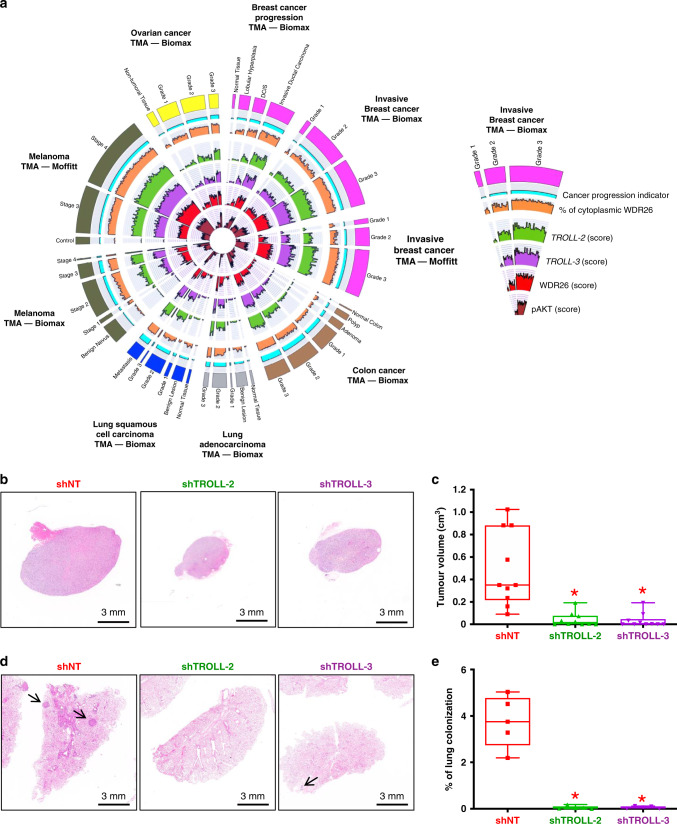
Fig. 5. Cytoplasmic WDR26 correlates with advanced cancers.
a Circos plot summarizing the expression of TROLL-2, TROLL-3, WDR26 and pAKT in TMAs of 378 cancers with progressive disease. b Representative H&E stained cross sections of melanomas derived from Malme-3M cells infected with the indicated shRNAs. c Quantification of the melanomas described in b. n = 5 mice for all groups, asterisk vs. NT, P < 0.005, two-tailed Student’s t test. d Representative H&E stained cross sections of lung colonies derived from Malme-3M cells infected with the indicated shRNAs. e Quantification of the lung colonies described in d. n = 5 mice for all groups, asterisk vs. NT, P < 0.005, two-tailed Student’s t test. Boxplots represent the individual data points, median and whiskers (min to max method). Source data are provided as Source data file.

