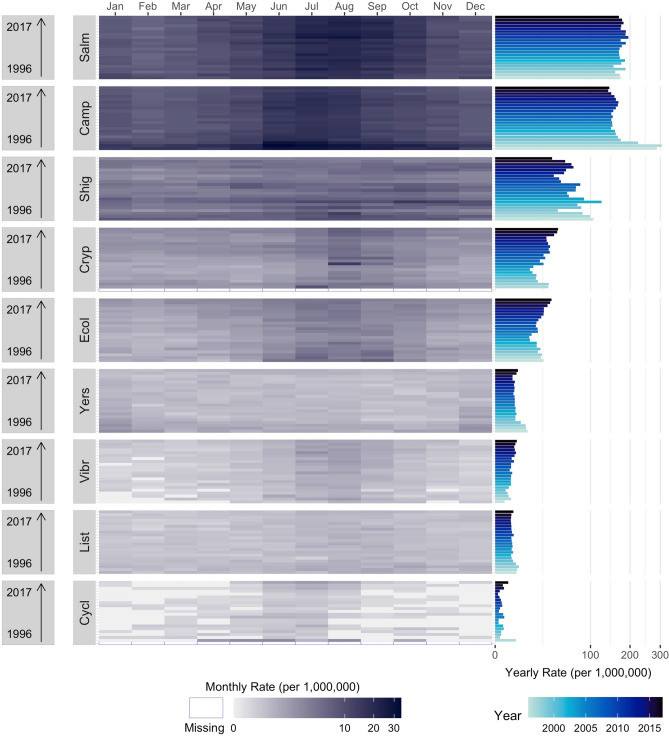
Figure 3.
Multi-panel calendar plots of monthly rates combined with yearly rates and peak timing (in month) and amplitude average estimates for nine infections: Salmonella (Salm), Campylobacter (Camp), Shigella (Shig), Shiga Toxin-producing E. coli (Ecol), Listeria (List), Vibrio (Vibr), Yersinia (Yers), Cryptosporidium (Cryp), and Cyclospora (Cycl) as reported by FoodNet in the United States from 1996 to 2017. Average peak timing and amplitude estimates are shown in the top panel, annual trends in rates are shown in the right-rotated bar-charts, and heat maps indicate monthly rates for each infection in the main panel.

