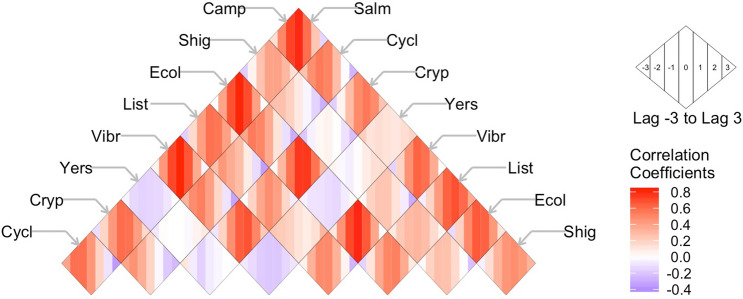
Figure 5.
Correlation coefficients across seven lags (− 3 to + 3) between pairs of nine infections Salmonella (Salm), Campylobacter (Camp), Shigella (Shig), Shiga Toxin-producing E. coli (Ecol), Listeria (List), Vibrio (Vibr), Yersinia (Yers), Cryptosporidium (Cryp), and Cyclospora (Cycl) as reported by FoodNet for the US from 1996 to 2017. Infection pairings are found at the intersection of diagonal rows. Shading intensity indicates the strength of correlations ranging from positive (red) to negative (blue) for each lag as a sequence of coloured stripes as shown in the inset.

