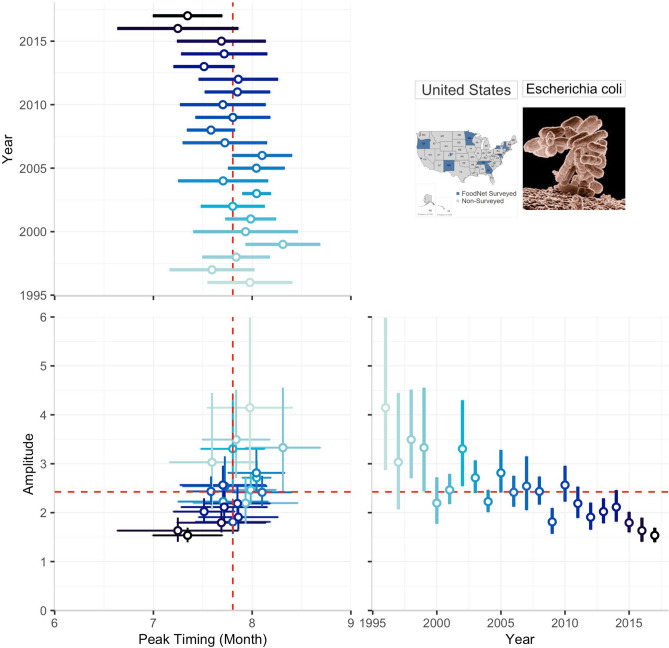
Figure 6.
The relationship between annual peak timing and amplitude estimates for Shiga Toxin-producing E. coli (STEC) in the US in 1996 to 2017. The multi-panel plot consists of two panels depicting forest plots for peak timing (upper panel) and amplitude (left panel) estimates along with their 95% confidence intervals by year, and the main panel demonstrating the associations between these two seasonality characteristics. Dashed red lines indicate the average peak timing and average amplitude across all years. The colour shade indicates the year of reporting and helps to note the decline in amplitude and the overall tendency to early peak timing that explain the nature of the observed positive correlation and potential synchronization over time.

