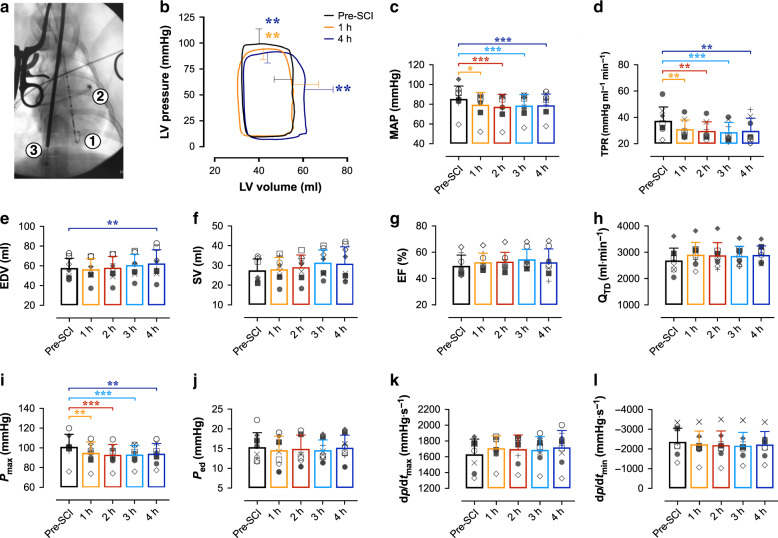
Fig. 1. Load-dependent LV function and hemodynamics in acute T2 SCI.
a In experiment 1, n = 8 animals were instrumented with a LV pressure-volume admittance catheter [1], Swan-Ganz catheter [2] advanced to the pulmonary artery, and a balloon-tip inferior vena cava (IVC) occlusion catheter [3] for transient reductions to preload and assessments of LV end-systolic elastance (Ees). b Basal pressure-volume loops represent mean interpolated data and error bars represent standard deviation (s.d.) for peak systolic pressure (Pmax) and end-diastolic volume (EDV) at baseline (pre-SCI, black), 1 h (orange) and 4 h (blue) post-SCI. Pmax was reduced within the first hour post-SCI (p = 0.0064) and remained lowered up to 4 h post-SCI (p = 0.0021). EDV was increased compared to pre-SCI at 4 h (p = 0.0038), though LV stroke volume (SV) was not significantly altered by the experiment endpoint. c Bar plots represent means, error bars show s.d., and symbols represent individual animal data. Mean arterial pressure (MAP) and d total peripheral resistance (TPR) were reduced within the first hour post-SCI (p = 0.0020 and 0.0067, respectively), and those reductions were sustained up to 4 h post-SCI (p ≤ 0.001 for both). e While EDV was augmented at 4 h post-SCI (p = 0.0038), f SV, g ejection fraction (EF), and h cardiac output (QTD) were unchanged post-SCI. i Pmax was impaired within 1 h post-SCI, but j end-diastolic pressure (Ped), k the maximal rates of systolic pressure generation (dp/dtmax), and l diastolic pressure decay (dp/dtmin) were unchanged within 4 h post-SCI. *p < 0.05, **p < 0.01, ***p < 0.001 versus pre-SCI. Data were assessed using a one-way repeated-measures ANOVA with Fisher’s LSD for post hoc comparisons versus pre-SCI data. See Supplementary Table 1 for detailed statistics. Source data are provided as a Source Data file.

