Figure 4.
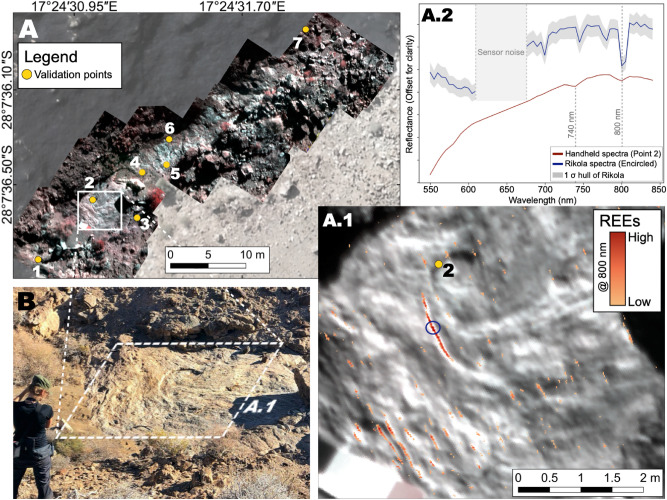
Marinkas Quellen. (A) UAV-based hyperspectral mosaic overlaying high-resolution UAV-based orthomosaic created in QGIS 3.12 (own data). The locations of in-situ measurements taken for validation are shown in yellow. (A.1) Close-up of the HSI data superposed with pixels mapped with 800 nm absorption feature (yellow to red indicating the increasing depth of the absorption feature i.e., high = very deep, low = shallow). The acquisition location of spectra shown in A.2 is represented by a blue circle and point 2. (A.2) Comparison of averaged Rikola with handheld spectra. (B) Field photo showing the area selected for Nd mapping.

