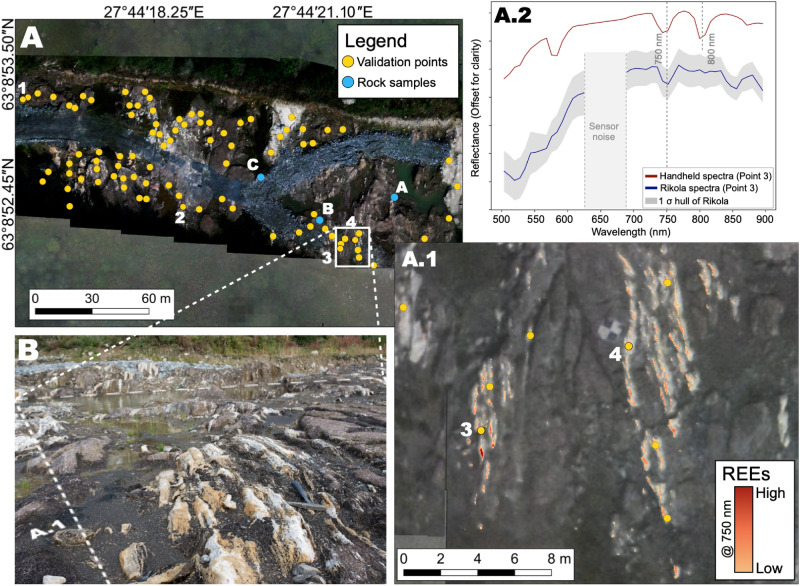
Figure 5.
Siilinjärvi. (A) UAV-based hyperspectral mosaic overlaying the high-resolution UAV-based orthomosaic created in QGIS 3.12 (own data). The locations of in-situ measurements taken for validation are shown in yellow and blue. (A.1) Close-up of the HSI data superposed with pixels mapped with 750 nm absorption feature (yellow to red indicating the increasing depth of the absorption feature i.e., high = very deep, low = shallow). The acquisition location of spectra shown in A.2 is represented by point 3. (A.2) Comparison of averaged Rikola with handheld spectra. (B) Field photo illustrating the area selected for Nd mapping.

