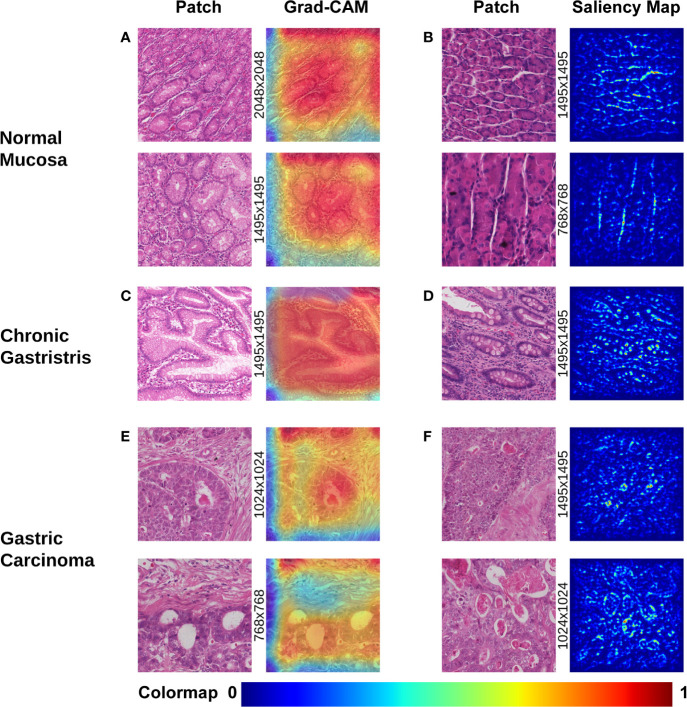
Figure 2.
Visualization of different gastric lesions by Grad-CAM and saliency map. (A) Normal mucosa. Left: Patches extracted from normal WSIs with 2,048×2,048 pixels and 1,495×1,495 pixels, respectively. Right: Grad-CAM presentation for the patches. (B) Normal mucosa. Left: Patches extracted from tubular-gland tissue regions with 1,495×1,495 pixels and 768×768 pixels, respectively. Right: Presentation of the saliency map for the patches. Note that the model captures the contour of the compact glands, which results in lucid lines in the saliency maps. (C) Chronic gastritis. Left: Patches extracted from intestinal metaplasia (IM) showing more intracytoplasmic mucin droplets of varying sizes and shapes. Right: Grad-CAM presentation for the patches. (D) Chronic gastritis. Left: Patches extracted from an IM lesion with more goblet cells. Right: Presentation of the saliency map for the patches. Note the lucid area of IM is different from normal mucosa. (E) Gastric carcinoma. Left: Cancerous patches with more stroma regions. Right: Grad-CAM presentation for the patches. Note that the red area with high attention captures the disordered cancer clusters. (F) Gastric carcinoma. Left: Cancerous patches from 1,495×1,495 pixels and 1,024×1,024 pixels, respectively. Right: Presentation of the saliency map for the patches. Note the lucid tubules reveal a significantly irregular shape.

