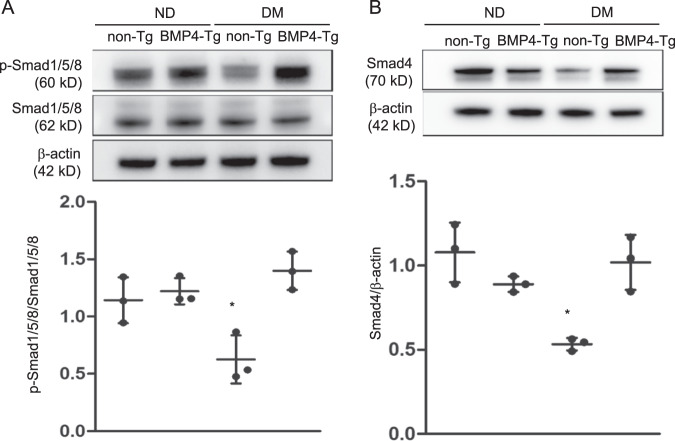
Fig. 2. BMP4 Tg expression re-activates Smads.
a Protein levels of phosphorylated Smad1/5/8 and Smad1/5/8 in E8.5 non-BMP4 Tg and BMP4 Tg embryos from nondiabetic (ND) or diabetes mellitus (DM) dams. Quantification of relative expression levels of phosphorylation of Smad1/5/8 versus total Samd1/5/8 was shown in the graphs. b Protein levels of Smad4 in E8.5 non-BMP4 Tg and BMP4 Tg embryos from nondiabetic (ND) or diabetes mellitus (DM) dams. Quantification of relative expression levels of Smad4 was shown in the graphs. Experiments were performed using three embryos from three different dams per group (n = 3); * indicates significant difference compared to the other groups (P < 0.05) in one-way ANOVA followed by Tukey tests. ND: nondiabetic; DM: diabetes mellitus.

