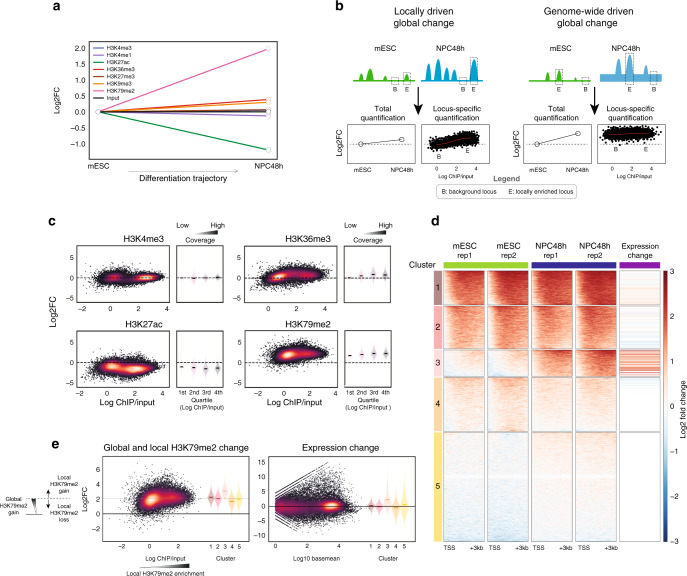
Fig. 2. H3K27ac and H3K79me2 undergo opposite global changes independent of transcriptional changes during in vitro neuronal differentiation.
a Representation of the global scaling factors (log2 transformed) estimated in NPC48h using quantitative ChIP-seq with respect to the reference mESC level, for the seven histone modifications included in this study (N = 2). b Model to illustrate that global histone modification changes can result from two different scenarios. Left panel: locally driven global changes may follow from increased number and/or magnitude of histone PTM local enrichment. Right panel: genome-wide driven global changes may follow from a genome-wide accumulation of a mark on both locally enriched regions (“peaks”) and on background regions. c MA plots showing the mean coverage (x-axis) and log2 fold-change (y-axis) of four histone marks computed on bins overlapping annotated genomic features for the contrast NPC48h vs mESC (H3K4me3 and H3K27ac: transcription start site (TSS) ± 2 kb; H3K79me2: TSS + 3 kb; H3K36me3: transcription termination site (TTS)−3 kb). Next to each MA plot, we show a summary plot showing the global fold-change distribution (y-axis) for each quartile of mean coverage (x-axis). d k-mean clustering (k = 5) of H3K79me2 enrichment 3 kb downstream of TSS of protein-coding genes. A standard scaling method (by sequencing depth) and normalization (by input-control) was used. This highlights changes with respect to local background. The last column shows the log2 fold-changes in the expression of the respective genes in each cluster for the contrast NPC48h vs mESC. Genes gaining local H3K79me2 enrichment tend to be upregulated during in vitro neuronal differentiation. e Left panel: MA plot showing the mean coverage (x-axis) and the global change in H3K79me2 (y-axis) computed on a window 3 kb downstream of TSS of protein-coding genes, next to a violin plot showing the global H3K79me2 changes for each of the five clusters previously identified in (d). The scheme on the right helps the interpretation of the global and local H3K79me2 changes. Right panel: MA plot of gene expression changes for the contrast NPC48h vs mESC, next to a violin plot showing the expression changes of genes clustered according to (d).

