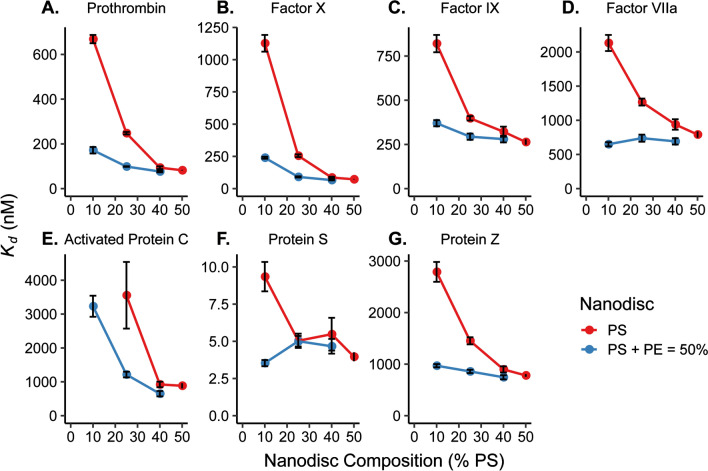
Figure 3.
Comparison of Kd values from binding of (A) PT, (B) fX, (C) fIX, (D) fVIIa, (E) aPC, (F) PrS, and (G) PrZ to Nanodiscs with (blue) and without (red) PE lipids. Kd values are plotted as a function of percent PS where the PS + PE lipid composition is equal to 50% for the PE lipid containing Nanodiscs. Each was determined by plotting relative shift of binding vs. concentration of protein and fitting to Eq. (1). Error bars represent the standard deviation from at least n = 4 microrings. Kd values for 50% PE/50% PC are not shown in the graphs due to the large error from the poor binding to this lipid environment by each clotting factor. # aPC binding to 10% PS without PE was too weak to calculate Kd. Plots generated in RStudio 1.1.453 and R 3.5.1 (https://www.R-project.org/) using the ‘ggplot2’ package.

