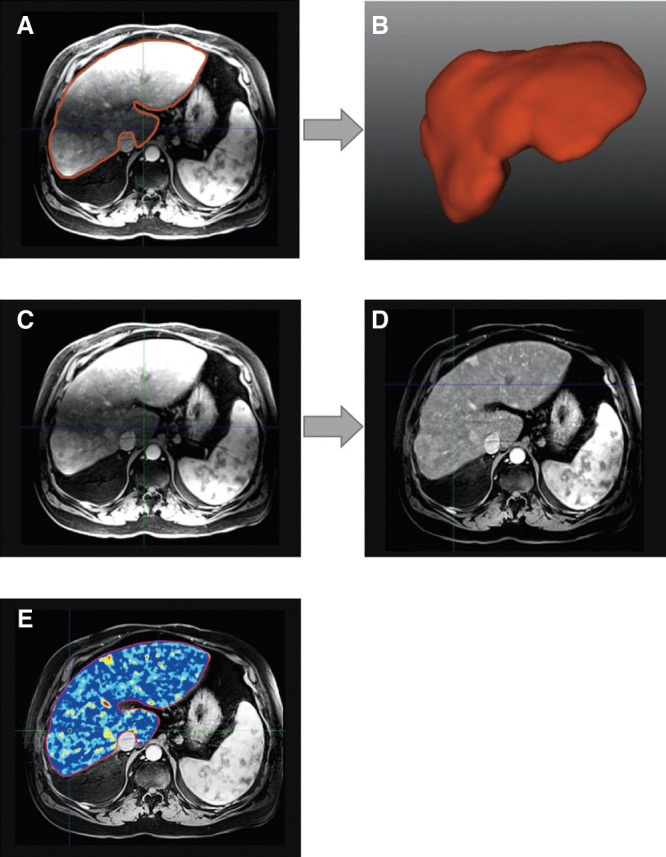
Fig. 1. Image processing workflow.

Whole liver 3D segmentation (red outline) on MR image (A) and its volumetric rendering (B). Before (C) and after (D) MR bias field correction. (E) Enhancing tumor volume colormap overlay. Note the heterogeneous tumor enhancement.
