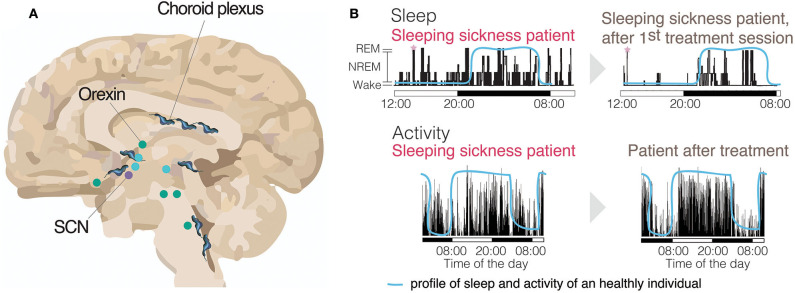
Figure 3.
Activity and sleep disruption in sleeping sickness patients. (A) Brain (sagittal section) with many of the sleep-wake regulating regions identified and the circadian master clock, the Suprachiasmatic Nucleus (SCN). Represented with trypanosomes is the parasite distribution across the brain. Wake promoting brain areas are represented in green. Sleep promoting brain areas are represented in blue (Scammell et al., 2017). (B, top panels) Electroencephalogram (EEG) recording of a sleeping sickness patient before and after the first treatment session, showing a clear reversal of the sleeping time to the nighttime upon treatment, similar to healthy individuals (blue line) (adapted with authorization from Buguet et al., 1999). The sleeping sickness patient record shows both increased sleep during the daytime and transitions from wake to REM state (SOREM), highlighted with pink stars. (B, bottom panels) An activity record of a sleeping sickness patient, measured by actigraphy, using activity watches. The same patient had his/her activity measured both before and after pentamidine treatment and show clear reversal of the abnormal activity profile after treatment (adapted with authorization from Njamnshi et al., 2012). The blue line represents the normal profile of a healthy individual.

