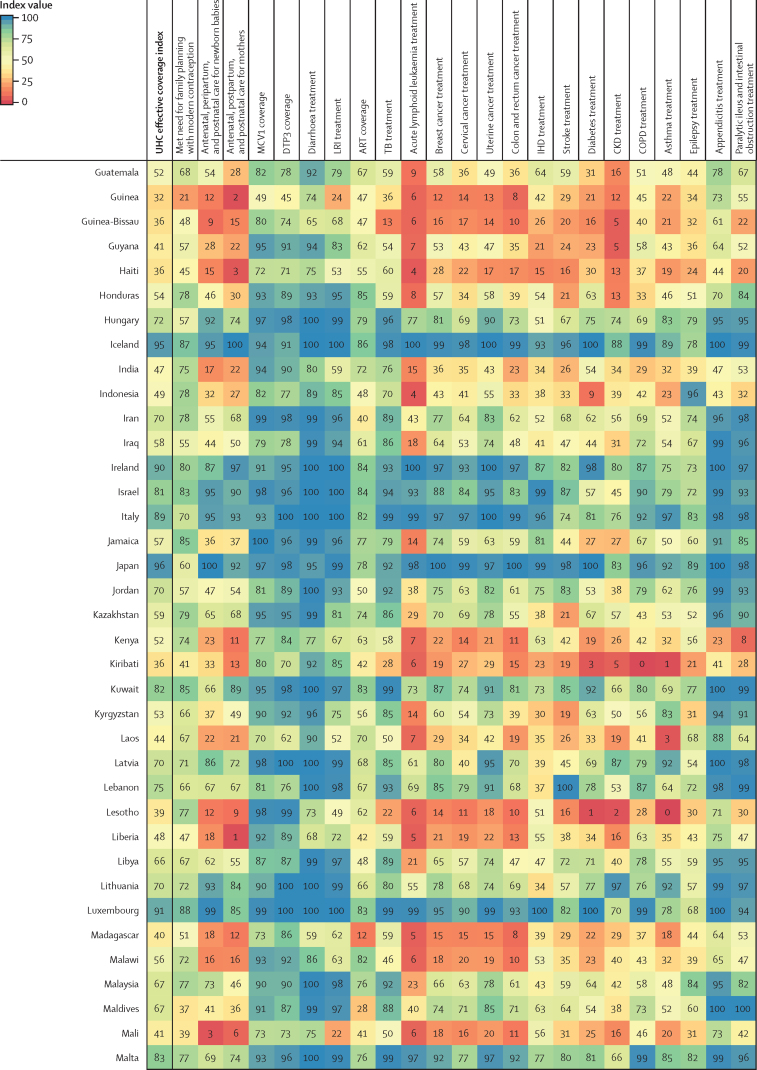
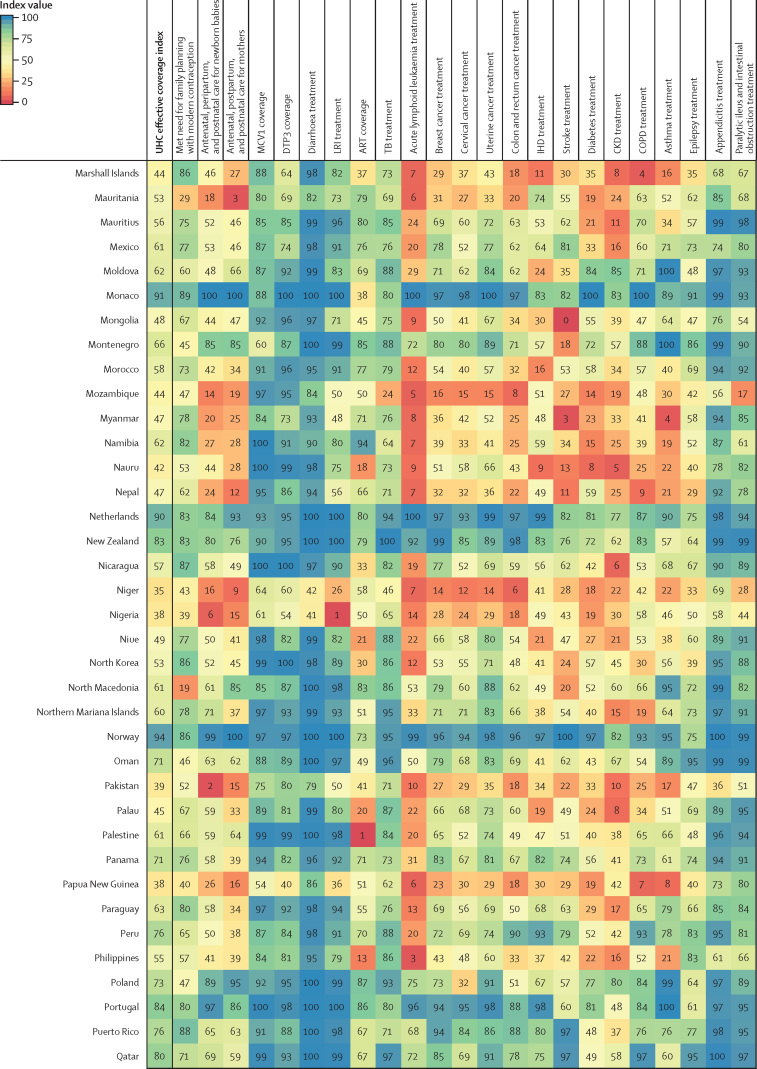
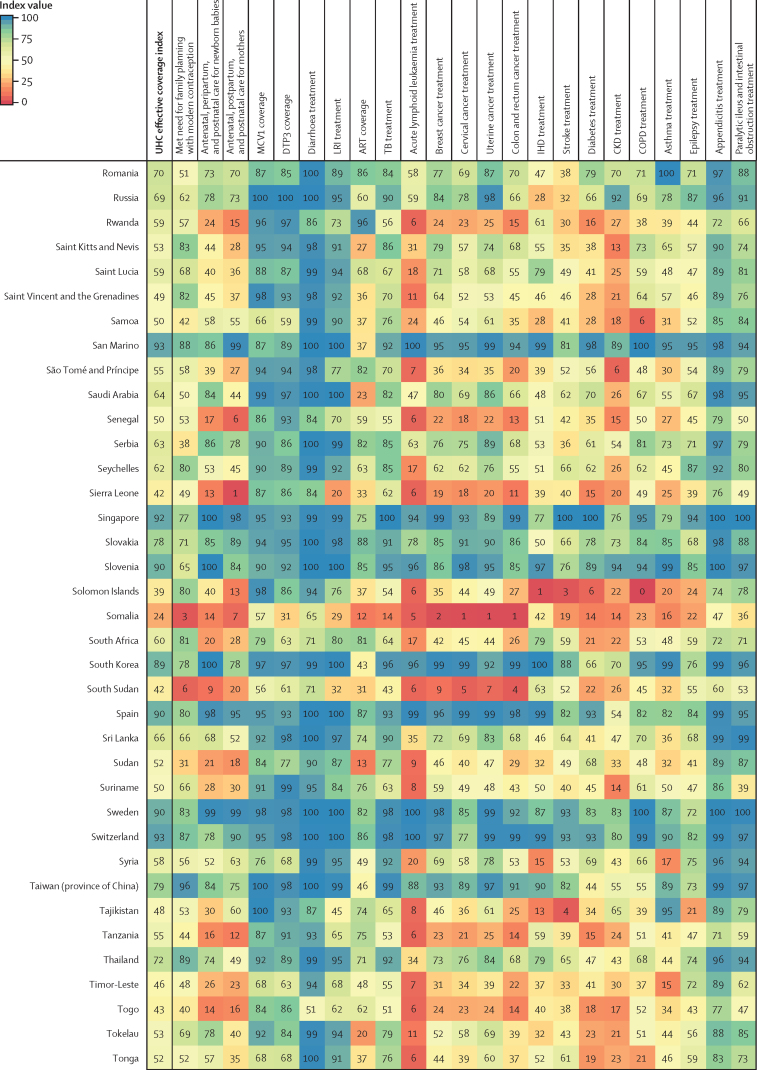
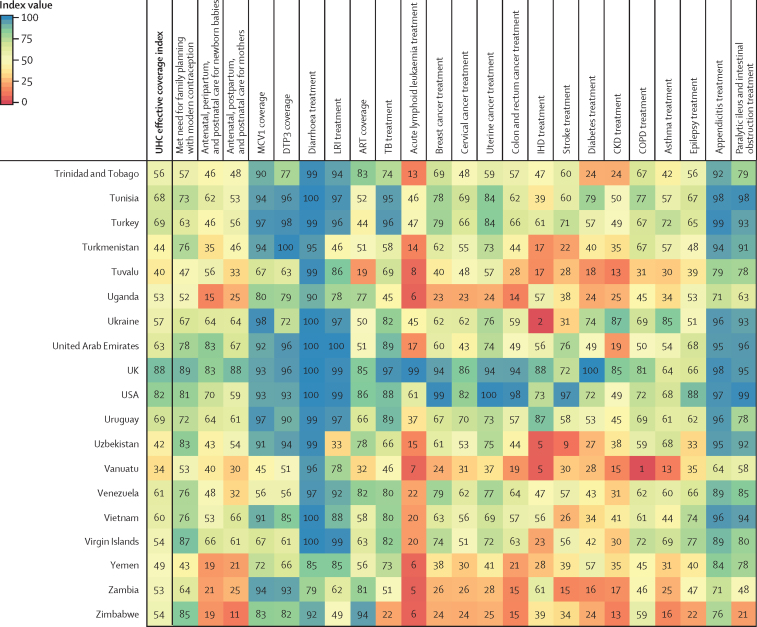
Figure 4.
Performance on the UHC effective coverage index and 23 effective coverage indicators, by location, in 2019
Locations are reported in alphabetical order. The UHC effective coverage index and individual effective coverage indicators are reported on a scale of 0–100. Four indicators (met need for family planning, MCV1 coverage, DTP3 coverage, and ART coverage) are based on intervention coverage, whereas the remaining effective coverage indicators use measures such as mortality-to-incidence ratios to approximate access to quality care; inputs and measurement approaches for each indicator and index are further described in appendix 1 (pp 30–32). ART=antiretroviral therapy. CKD=chronic kidney disease. COPD=chronic obstructive pulmonary disease. DTP3=diphtheria, tetanus, pertussis vaccine, 3 doses. IHD=ischaemic heart disease. LRI=lower respiratory infection. MCV1=measles-containing vaccine, 1 dose. TB=tuberculosis. UHC=universal health coverage.


