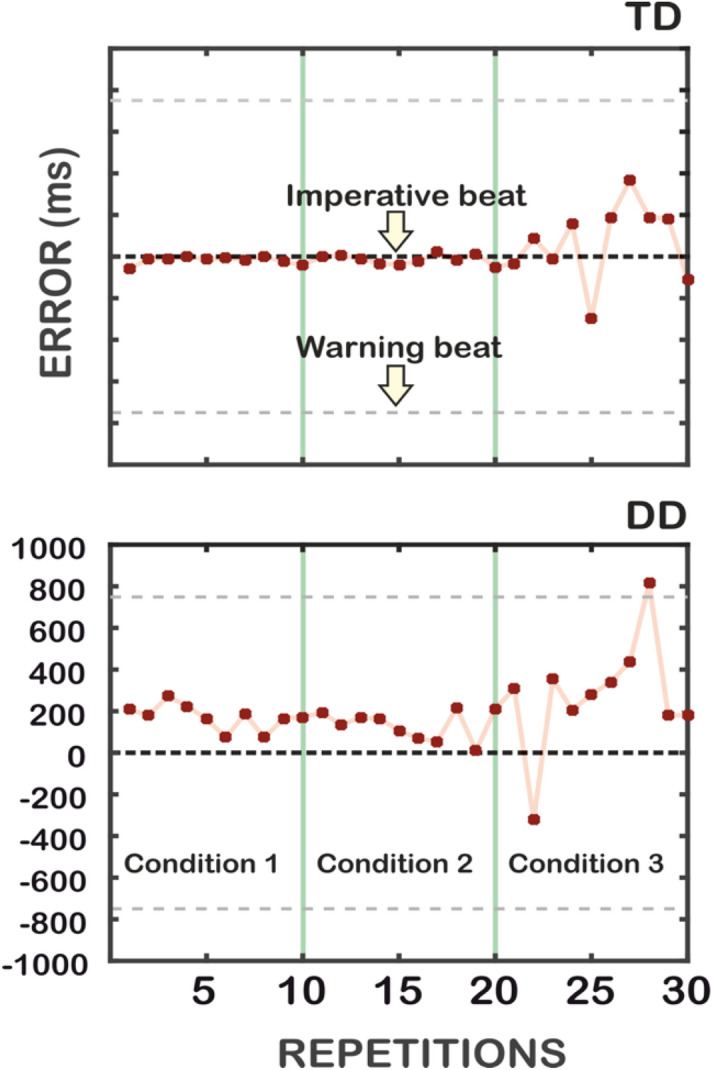
Figure 1.

Timing error of a TD (upper panel) and of a DD participant (lower panel), adult participants. On the X-axis, the 30 repetitions of IB (ten for each condition) are reported. On the Y-axis, the timing error (in ms) is reported. Time zero represents the time of occurrence of the IB (corresponding indeed to the expected response). Red markers stand for observed responses. Positive errors represent delayed responses; negative errors represent anticipated responses; zero errors represent flawless synchrony. Green vertical lines separate the three conditions.
