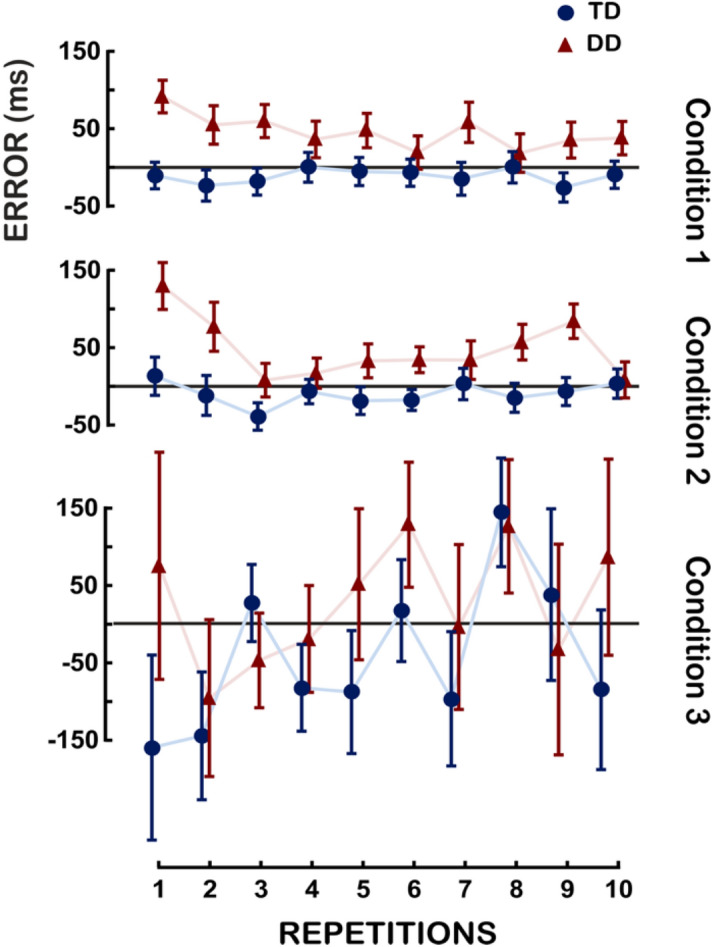
Figure 2.

Timing error of the Unstressed (Condition 1), the Stressed (Condition 2) and the Unpredictable (Condition 3)—adult participants. The interaction Group × Repetition is reported for the three experimental conditions. On the X-axis the mean of the ten repetitions is reported. On the Y-axis the timing error (which is calculated as the difference between the observed time, namely the participant’s response, and the expected time, namely the IB) is reported. Vertical bars represent the Standard Error.
