Figure 1.
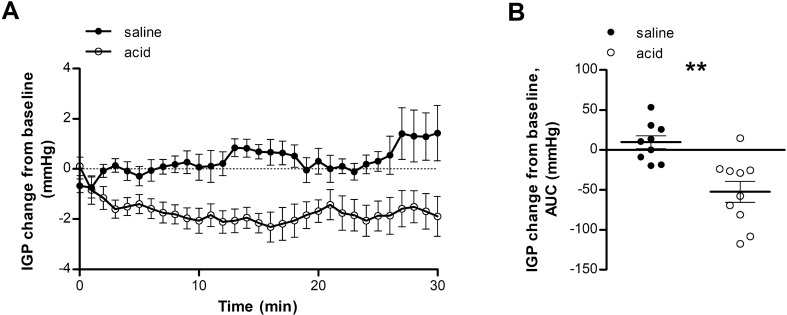
Duodenal acid perfusion relaxes the proximal stomach. IGP during saline perfusion (black dots) and acid perfusion (white dots) was evaluated using a high-resolution manometry catheter. (A) Time curve of IGP during saline or acid perfusion. (B) AUC of IGP during saline or acid perfusion. n = 9 for saline perfusion and n = 10 for acid perfusion. Data are mean ± SEM; **P < 0.01. AUC, area under the curve; IGP, intragastric pressure.

