Figure 3.
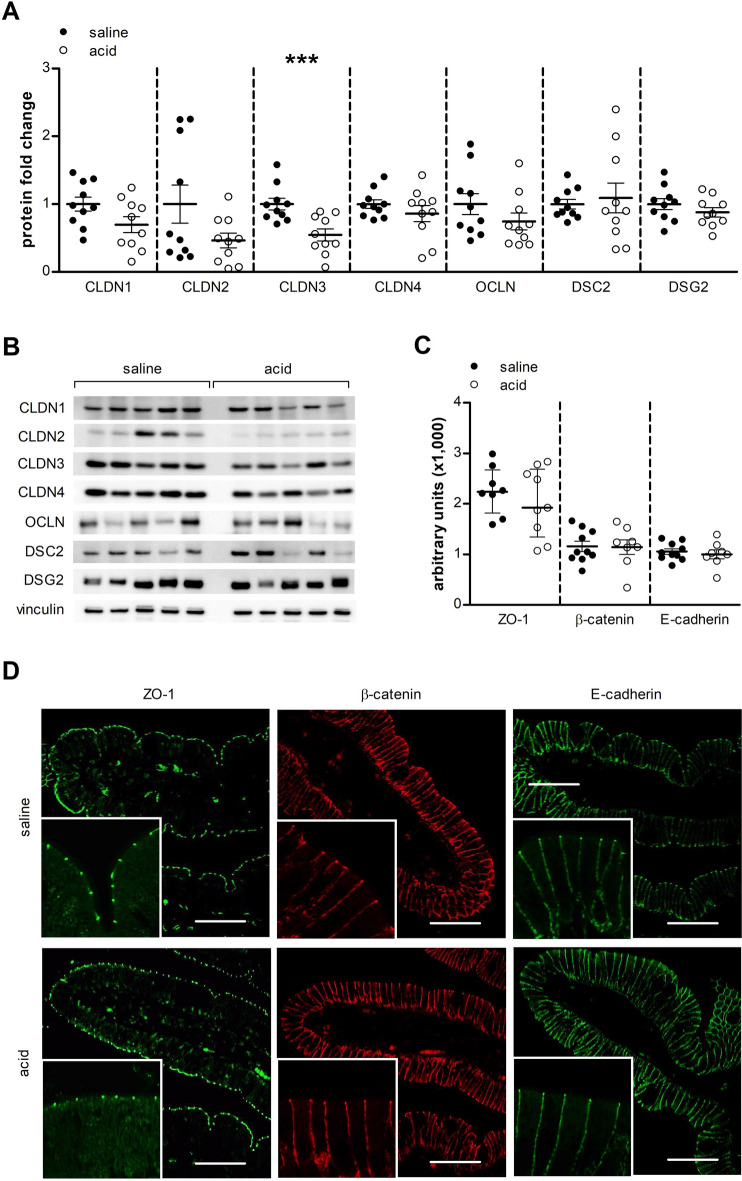
Expression of cell-to-cell adhesion proteins in the duodenal mucosa. (A) Protein expression of CLDN1-4, OCLN, DSC2 and DSG2 was evaluated by western blot (n = 10 for both groups). (B) Representative western blot of five saline perfused and five acid perfused subjects. Bands were cropped from different parts of the same gel, or from different gels. (C) Protein expression and localization of ZO-1 (n = 8 saline and n = 9 acid), β-Catenin (n = 10 saline and n = 8 acid) and E-cadherin (n = 10 saline and n = 8 acid) was assessed by immunofluorescence after intraduodenal saline (black dots) and acid (white dots). (D) Representative confocal images in mucosal biopsy specimens obtained after saline (top) and acid (bottom) perfusion. Scale bars: 50 µm. Data are mean ± SEM; ***P < 0.001. CLDN, claudin; DSC2, desmocollin-2; DSG2, desmoglein-2; OCLN, occludin; ZO-1, zonula occludens 1.

