Figure 4.
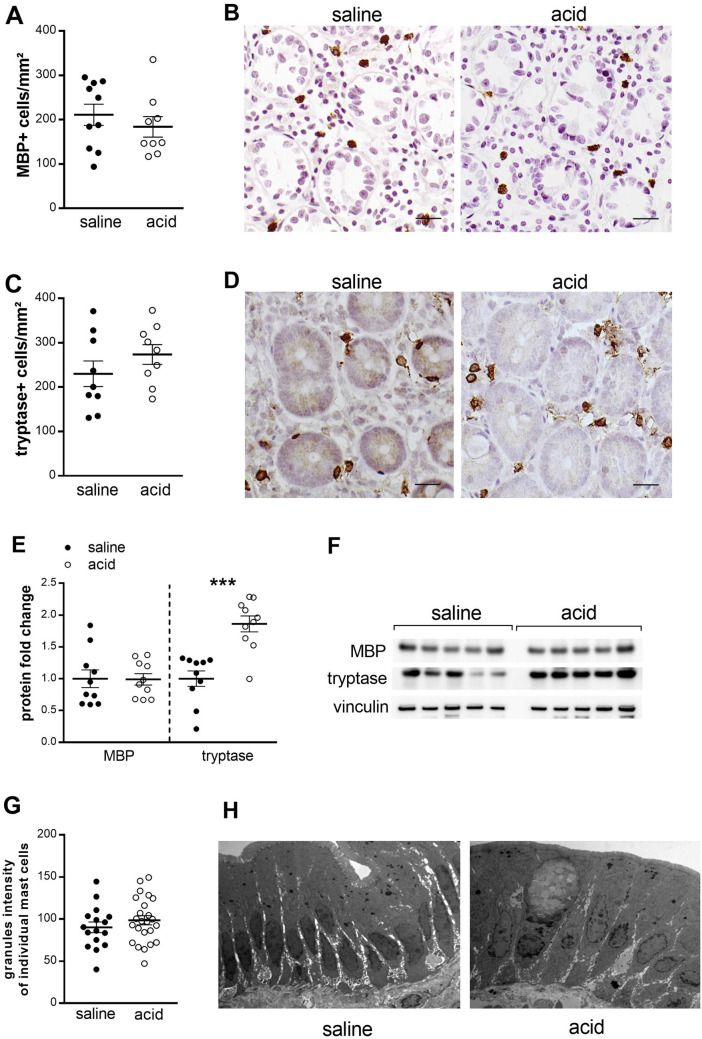
Duodenal acid induces tryptase expression, without changing mast cell counts or ultrastructure. Duodenal biopsy samples after saline perfusion (black dots) and after acid perfusion (white dots) were stained for eosinophils using eosinophilic MBP (n = 10 for saline and n = 9 for acid perfusion) (A) and for mast cells using tryptase (n = 9 for both groups) (C). Representative images of MBP (B) and tryptase (D) immunohistochemistry in mucosal biopsy specimens obtained after saline (left) and after acid perfusion (right). Scale bar: 20 µm. (E) Protein expression of MBP and tryptase was measured by western blot after intraduodenal saline (black dots) and acid (white dots) perfusion (n = 10 for both groups). (F) Representative western blot of five saline perfused and five acid perfused subjects. Bands were cropped from different parts of the same gel, or from different gels. (G) Electrodensity of the mast cells granules after saline and acid perfusion. (H) Similar ultrastructure of the duodenal epithelium after saline and acid perfusion showing no changes in cell morphology or integrity of the epithelium (×3000). Data are mean ± SEM; ***P < 0.001. MBP, eosinophilic major basic protein.

