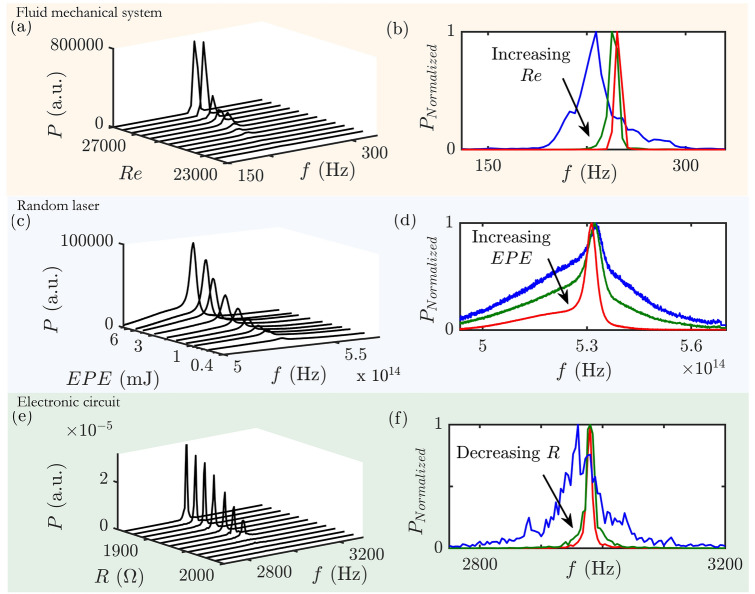
Figure 2.
Evolution of the spectrum for fluid mechanical, optical and electronic systems. The evolution of power spectrum with variation in the corresponding control parameter is presented on the left side and the normalized spectra for each system are given on the right side of the panel. (a,b) Power spectra obtained using Fast Fourier Transform (FFT) of the acoustic pressure fluctuations for a laboratory-scale bluff body stabilized combustor of length 700 mm. The power spectra exhibit an increasing dominance of a single peak on approaching oscillatory instabilities (for increasing Re) in all the fluid mechanical systems discussed in this paper, and hence this figure is a representative example. (c,d) Emission spectra of the random laser as we progressively increase EPE. The power spectrum is obtained by multiplying the photon count per second for each wavelength with its respective energy. The broad spectrum starts to become a narrow lasing-like peak with increase in EPE. (e,f) Power spectra obtained using FFT of the voltage signal () measured from Chua’s circuit and the corresponding normalized spectra are shown respectively. The peak sharpens during the transition to limit cycle oscillations as the resistance (R) is decreased. The power spectra using FFT are plotted for a resolution of 4 Hz for visualization purpose.

