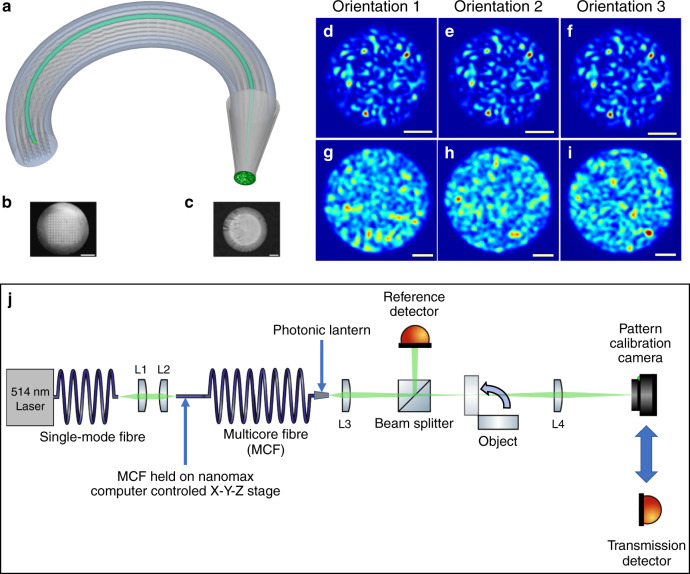
Fig. 1. Computational imaging using a photonic lantern.
a Schematic Ns = 25 square-array multicore fibre with a photonic lantern at one end. (in green) Light in one core excites a fixed light pattern at the lantern’s output. b Optical micrograph of the facet of the Ns = 121 multicore fibre used in this work. Scale bar: 50 μm. c Optical micrograph of the multimode output of the photonic lantern. Scale bar: 10 μm. d–f Near field intensity patterns at the output of the photonic lantern when one core of the multicore fibre is excited with monochromatic light (λ = 514 nm). The patterns are insensitive to fibre bending as shown by the micrographs obtained for three arbitrary conformations of the fibre. Scale bars: 10 μm. g–i Near field intensity patterns at the output of a 105 μm core multimode fibre when excited with monochromatic light (λ = 514 nm). As shown in the micrographs obtained for three arbitrary conformations of the fibre, the patterns are highly sensitive to bending of the fibre. Scale bars: 20 μm. j Experimental setup used to acquire the data during the photonic lantern imaging experiments. Full details of the data acquisition procedure are given in the “Methods” section.

