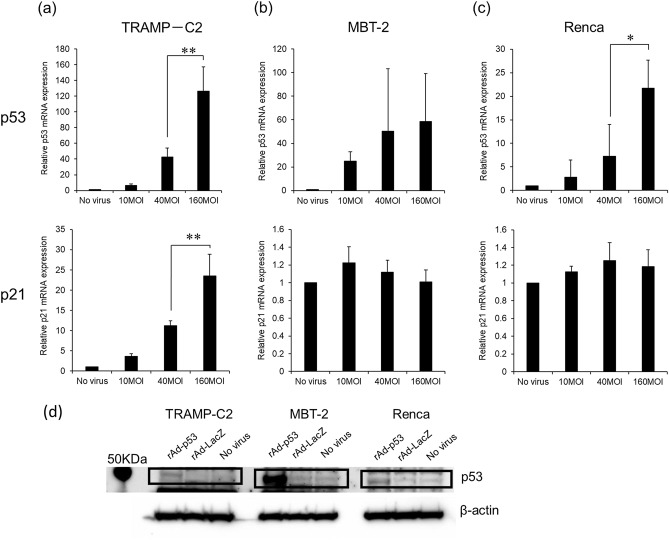
Figure 2.
The relative mRNA expression of p53 and p21 genes and protein expression of p53 in TRAMP-C2, MBT-2, and Renca cell lines. Relative mRNA expression of p53 and p21 in TRAMP-C2 (a), MBT-2 (b), and Renca (c), was determined by real-time PCR after infection with rAd-p53 at 10, 40 and 160 MOI. Each data point represents the average of triplicate relative values normalized by the value when cells were treated with no virus from three different experiments: bars ± SD, (*p < 0.05, ** p < 0.01). β-Actin was used as an endogenous RNA control to normalize for differences in the amount of total RNA. (d) Over-expressions of p53 protein were observed in all three cell lines infected with rAd-p53 by Western blotting. The original images of the Western blotting gels were shown in ‘supplementary file’.

