Fig. 1.

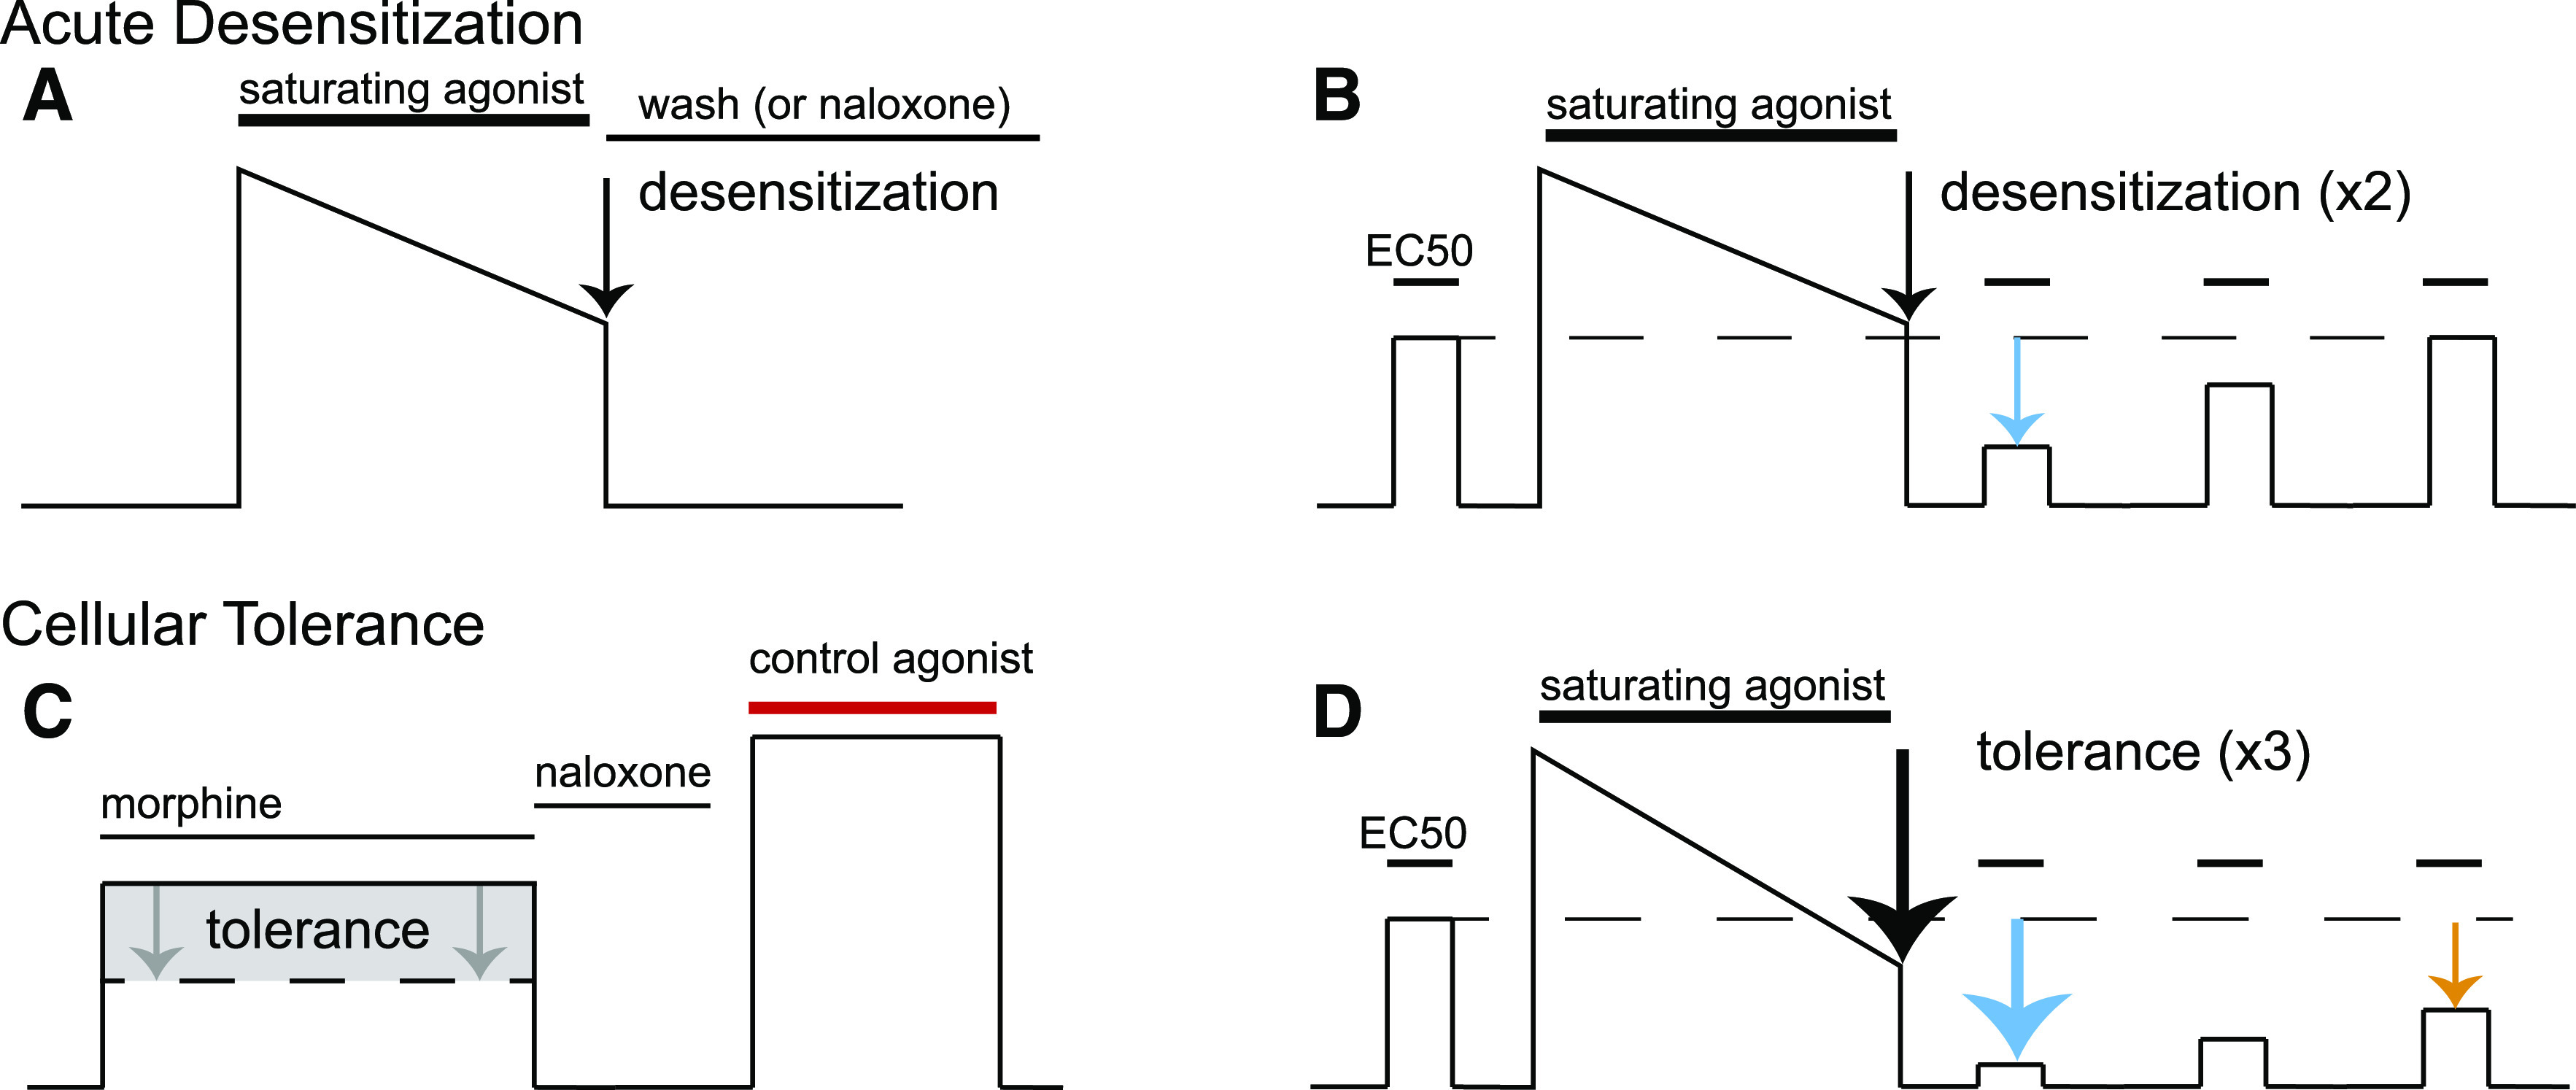
Illustrations of electrophysiological experimental measures of desensitization and cellular tolerance. Desensitization is generally measured in two ways: first as in (A), an acute decrease in the response, usually a current or voltage measurement, in the continued presence of a saturating concentration of agonist over a period of minutes (generally 5–10 minutes). The extent of this decrease in signaling is acute desensitization (black arrow). Reversal of this signaling by agonist washout or application of antagonist is used to ensure that the baseline measurement has not changed during the experiment. The second measure of desensitization (B) is used in preparations such as cell culture or with agonists that can quickly be washed out of brain slices like [Met5]enkephalin. First, a moderate concentration of agonist is applied to elicit approximately a half-maximal response (EC50). Next, a saturating concentration of agonist is applied for minutes, similar to the protocol shown in (A), to desensitize the receptor (black arrow). The saturating agonist is washed out of the preparation, and then the EC50 concentration of agonist is retested periodically to measure desensitization (cyan arrow) and the recovery from desensitization over time, which is nearly complete after 30–45 minutes. Cellular tolerance to chronic drug treatment is measured in several ways as well. (C) First, an agonist such as morphine is applied, and a response is measured; this is then reversed with an antagonist such as naloxone. Then, a control agonist that activates another receptor but ultimately activates the same downstream effector is tested (red bar). The relative response to morphine vs. the control agonist is measured. This is done in preparations from naïve animals (black line) or animals that have been chronically treated with morphine or other opioids for a period of days [generally 5–7 days (dotted line)]. The readout of cellular tolerance is a decrease in the response of morphine after chronic morphine treatment (gray shaded box, gray arrows) when normalized to the control agonist. (D) A second hallmark of opioid signaling in morphine-tolerant animals is an increase in desensitization after chronic morphine treatment. A protocol identical to that done in (B) is done on chronically morphine-treated mice; there is a characteristic increase in the decline in signaling in response to the saturating concentration of agonist (black arrow) as well as a smaller response to the EC50 concentration after acute desensitization (cyan arrow). Furthermore, the rate of recovery from desensitization is prolonged, and the recovery from desensitization is incomplete (orange arrow).
