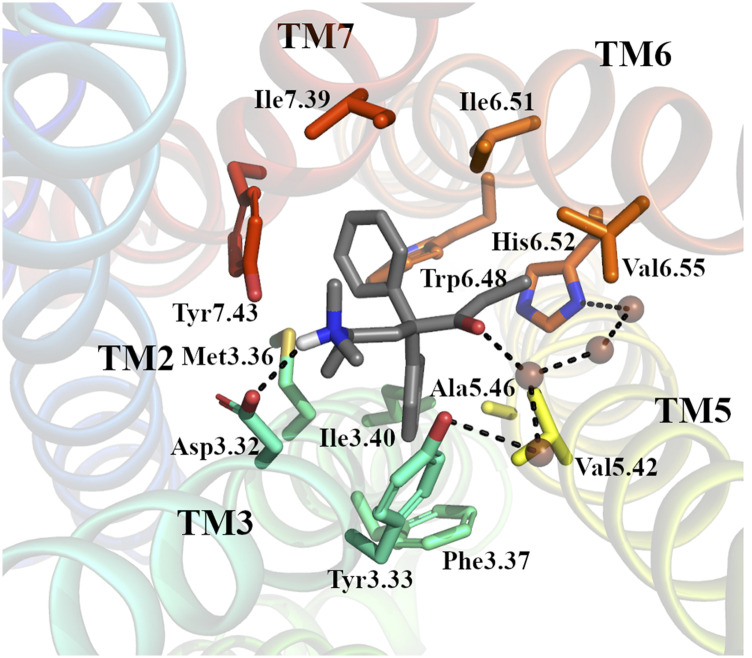
Fig. 1.
The binding pose of methadone to active MOR. Representative pose from 100-nanosecond simulation of the top-ranked IFDP2 by metadynamics. MOR is shown in cartoon representation with helices colored from blue (TM1) to red (TM7). Methadone (in gray) and residue side chains forming interactions in more than 70% simulation frames (see Supplemental Fig. 8) are shown as sticks. Water molecules are shown as brown spheres. Dotted lines illustrate hydrogen bond interactions.

