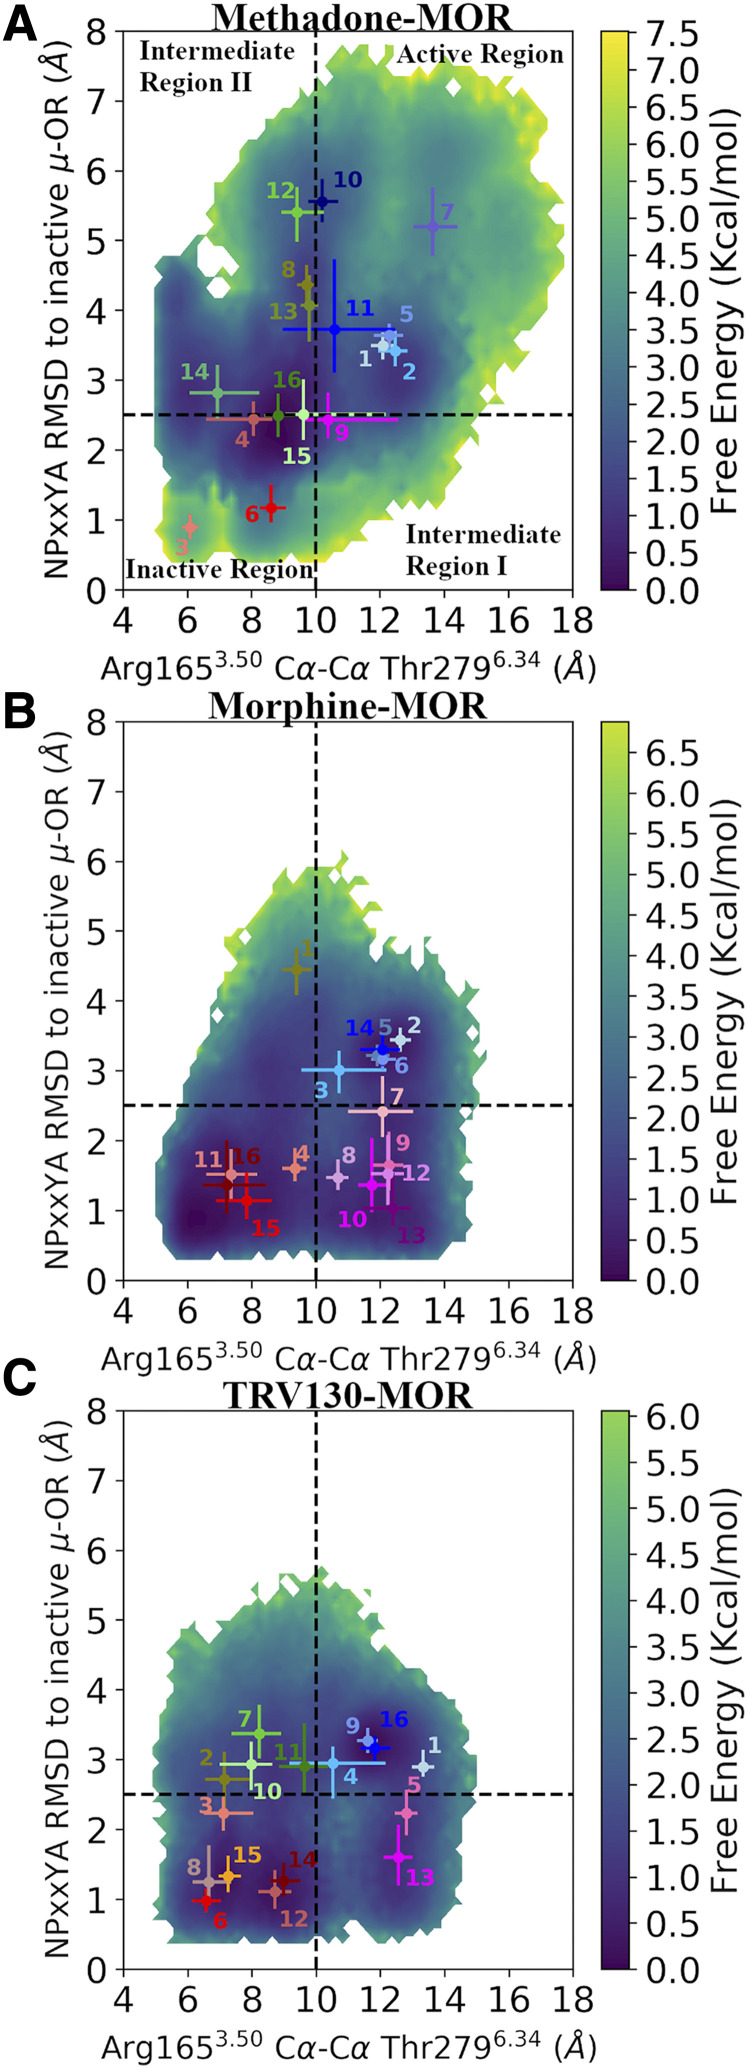
Fig. 2.
Free energy surfaces of A) methadone-, B) morphine-, and C) TRV130-bound MOR systems as a function of two-order parameters associated with receptor activation. Specifically, the two-order parameters refer to the TM6 outward movement captured by the Arg1653.50-Thr2796.34 Cα distance and the backbone distortion of the NPxxY motif measured as RMSD of the NPxxYA segment from the corresponding region in the inactive MOR crystal structure. Dotted black lines define the boundaries of the four identified conformational regions (Active, Inactive, Intermediate I, and Intermediate II). Dots represent reweighted averages of the two-order parameters in the identified 16 kinetic macrostates for each ligand-bound MOR system. The 16 kinetic macrostates are numbered as in Supplemental Fig. 6 and are colored based on the region they fall within. Specifically, macrostates in the “Active region,” “Inactive region,” “Intermediate region I,” and “Intermediate region II” are colored in shades of blue, red, magenta, and green, respectively. Error bar refers to first and third quartiles of the distribution of two order parameters in each macrostate. OR, opioid receptor.

