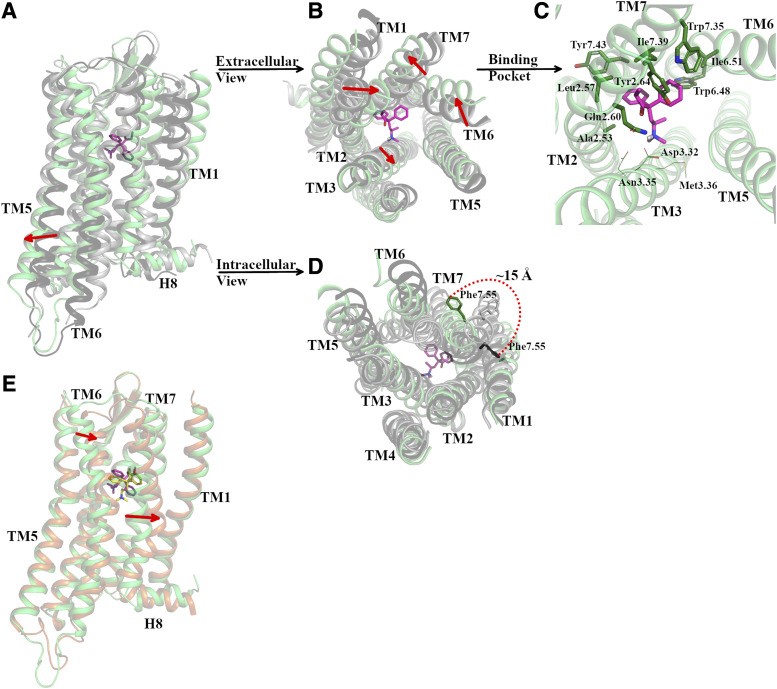
Fig. 5.
Representative conformation of the most probable macrostate (#16, I21) of the methadone-MOR system compared with active and inactive MOR crystal structures as well as to the second most probable macrostate (#15, I22). Cartoon representations of the receptor are in green, orange, dark gray, and light gray colors for macrostate #16, macrostate #15, active MOR crystal structures, and inactive MOR crystal structures, respectively. The ligand bound to the representative MOR conformation of macrostate #16 is shown in magenta sticks, whereas the ligand bound to the representative MOR conformation of macrostate #15 is shown in yellow sticks. (A) Vertical view of the MOR, (B) extracellular view of MOR, (C) methadone binding pose with MOR residues shown as sticks if forming interactions with the ligand in >70% of simulation frames or lines if interacting with the ligand in 40%–60% of frames. (D) Intracellular view of MOR. (E) Vertical view of the representative conformation of macrostate #16 (green cartoon) superimposed onto macrostate #15 (orange cartoon) with bound methadone shown in magenta and yellow sticks, respectively. The direction of red arrows in (A, B, and E) indicates the outward or inward movements of the TM segments, whereas the red-dotted curve in (D) indicates the change in orientation of Phe3387.55 in macrostate #16 with respect to its position in the active MOR crystal structure.

