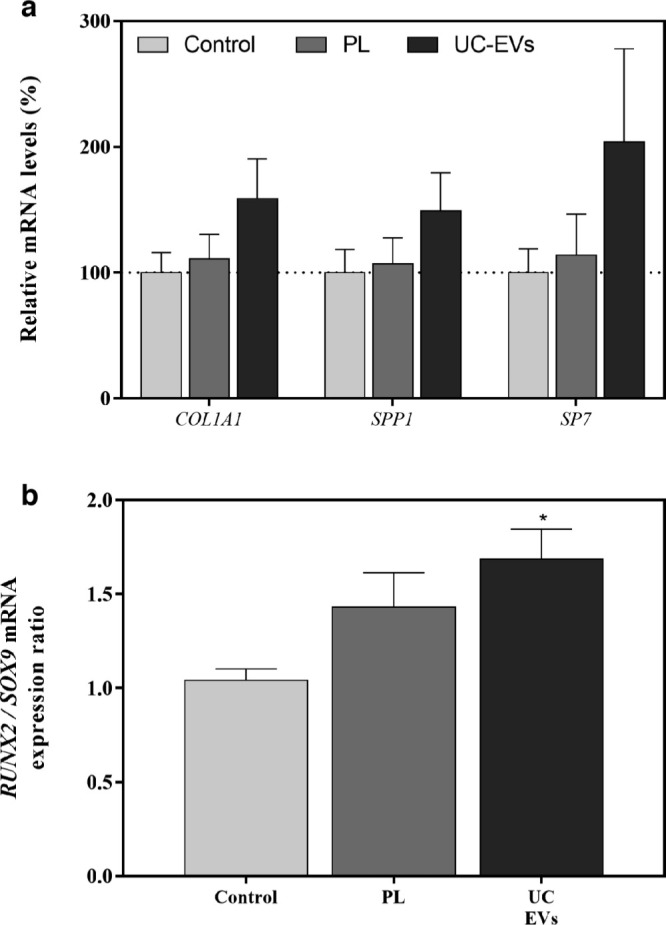
Fig. 2.

a) Messenger RNA (mRNA) expression levels in mesenchymal stromal cells (MSCs) after 14 days of platelet lysate (PL) and ultracentrifuged extracellular vesicle (UC-EV) treatments of collagen type I α 1 chain (COL1A1), Osteopontin (SPP1), and Osterix (SP7). Data represent the mean and standard error of the mean (SEM) for each group. Gene expression levels were normalized to reference genes and to the control group, which was set to 100%. b) Runt-related transcription factor 2 (RUNX2)/Sapiens SRY-box 9 (SOX9) ratio mRNA levels were divided by the SOX9 mRNA levels. Data represent the mean and SEM for each group. Results were compared using the Kruskal-Wallis test. *Statistically significant (p < 0.05) differences compared to the control group.
