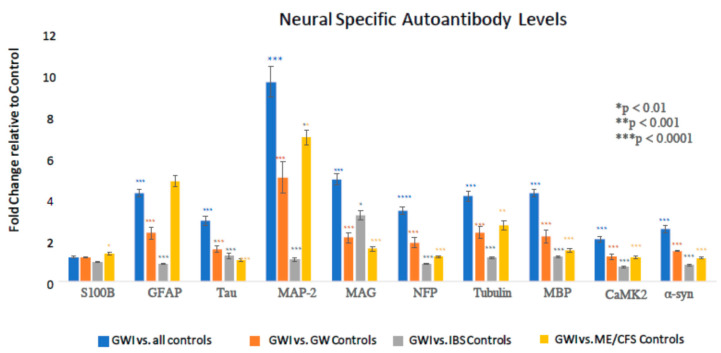
Figure 4.
Neural autoantibodies in plasma of GWI cases, GW healthy controls, IBS controls, and ME/CFS controls. *** p < 0.0001 (blue) GWI group to all three control groups combined using ANCOVA adjusted for age, sex, and race. *** p < 0.0001 (orange) GWI group to GW veteran control group using ANCOVA adjusting for age, sex, and race. *** p < 0.0001 (grey) GWI group to IBS group using ANCOVA adjusting for age, sex, and race. *** p < 0.0001 (yellow) GWI group to ME/CFS group using ANCOVA adjusting for age, sex, and race.

