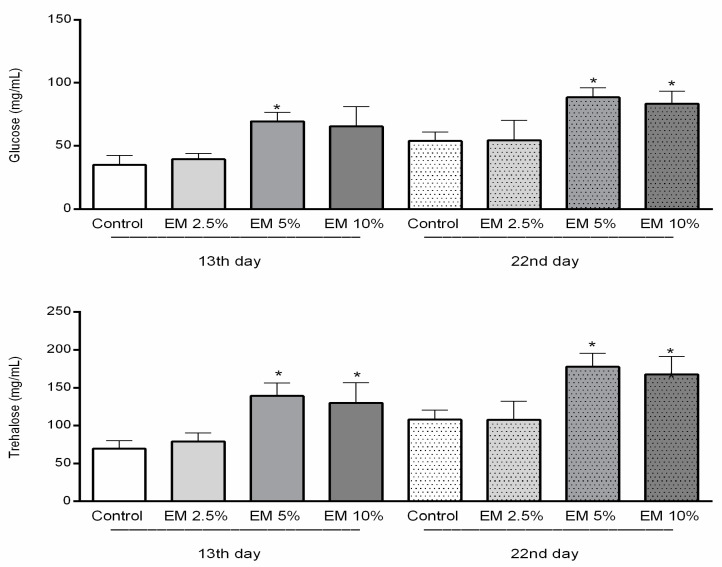
Figure 5.
Concentrations of glucose and trehalose in honey bee hemolymph sampled on the 13th and 22nd day of the experiment in laboratory-controlled conditions for control and experimental groups (EM 2.5%, EM 5%, EM 10%). Asterisks indicate statistically significant differences, Control vs. EM 5% and EM 10%; * p < 0.001; mean ± SD.

