Figure 5.
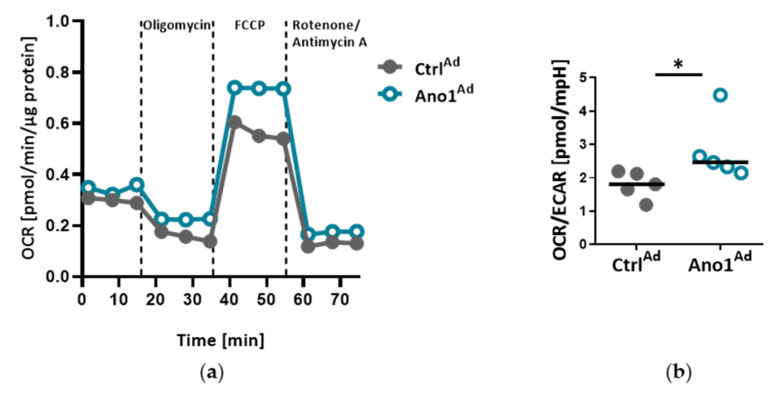
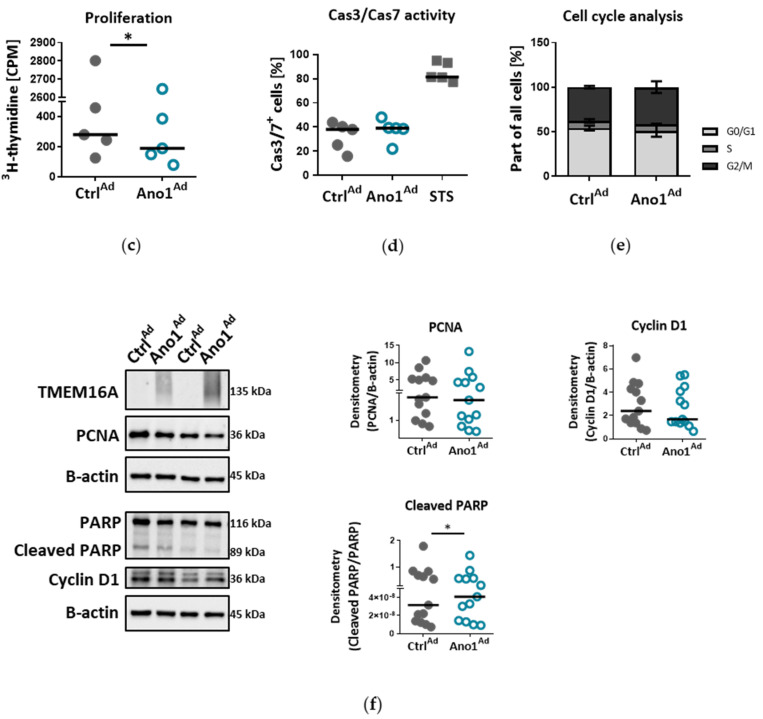
Enhanced TMEM16A mediates metabolic changes of PAECs. (a–b) Seahorse mitochondrial stress test profiles of TMEM16A-overexpressing primary PAECs showing the ratio of oxygen consumption rate (OCR) to extracellular acidification rate (ECAR) OCR/ECAR. (c) Proliferation of human PAECs overexpressing TMEM16A measured with thymidine incorporation (n = 5). (d,e) Cas3/Cas7 apoptosis assay and cell-cycle analysis of human PAECs overexpressing TMEM16A. (STS = staurosporin). (f) Western blots of PAECs infected with TMEM16A-overexpressing Ano1Ad or control CtrlAd with quantifications of PCNA, cleaved PARP/PARP and Cyclin D1. Figures were generated with 13 separate sets of experiments. * p < 0.05, ratio-paired (a) or paired t-test.


