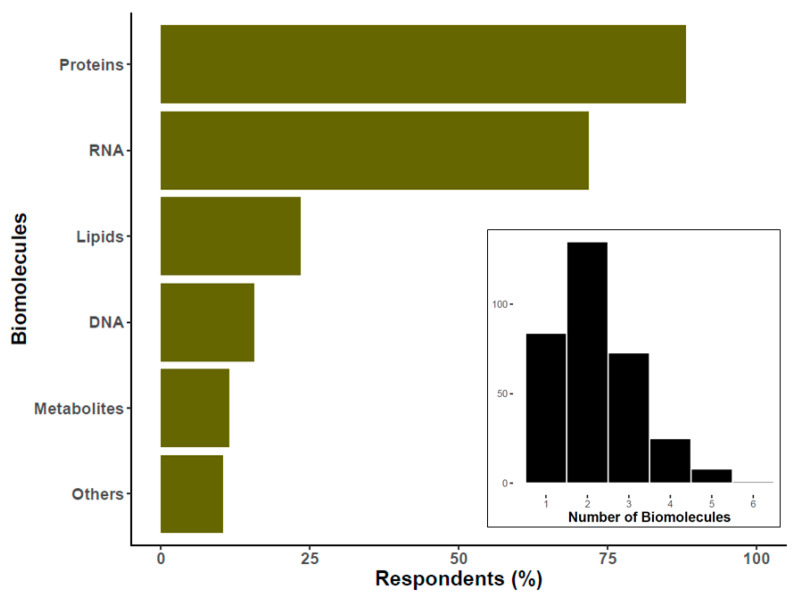
Figure 5.
Percentage of researchers interested in specific types of EV-associated biomolecules. The histogram at the bottom of the graph reflects the number of researchers (Y-axis) that study the specified number of biomolecule classes (X-axis). For the main graph, the percentage was calculated over 326 respondents. Please note that this question had the possibility of multiple answers.

