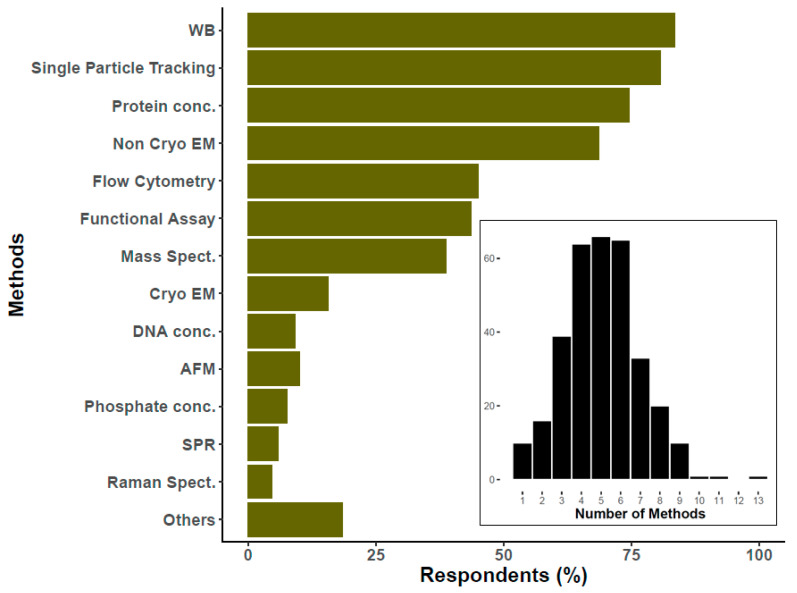
Figure 6.
Percentage of researchers that use specific technique to characterize EVs. The histogram at the bottom of the graph reflects the number of researchers (Y-axis) that use the specified number of methods to characterize EVs (X-axis). For the main graph, the percentage was calculated over 326 respondents. Please notice that this question had the possibility of multiple answers. Atomic force microscopy (AFM), Cryogenic electron microscopy (Cryo EM), DNA concentration (DNA conc.), Flow cytometry, Functional assays (Functional Assay), Mass spectroscopy (Mass Spect.), others (including among others ELISA, Colorimetric nanoplasmonic, and Next Generation Sequencing), Particle tracking (Single Particle Tracking), Phosphate/phospholipids concentration (Phosphate conc.), Protein concentration (Protein conc.), Raman spectroscopy (Raman), Surface plasmon resonance (SPR), Transmission or scanning electron microscopy (Non Cryo EM), Western blotting (WB).

