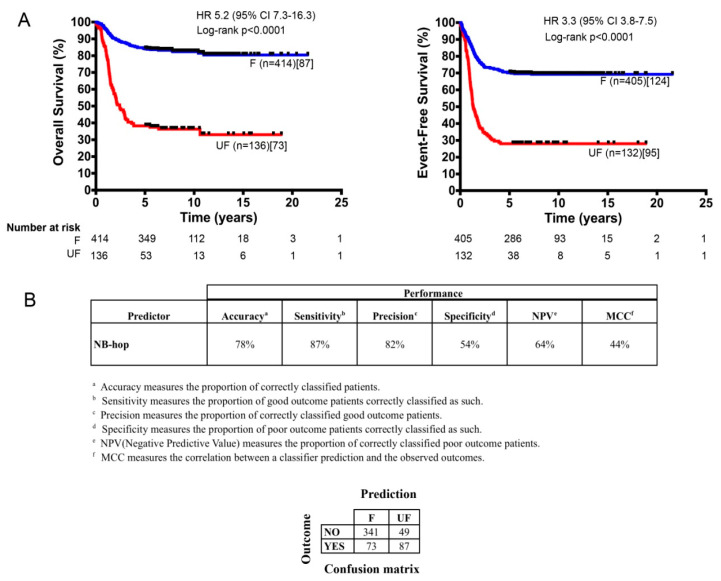
Figure 2.
Kaplan–Meier estimates of Overall survival (OS) and Event-free survival (EFS) and prediction performances of the NB-hop classifier (A). The OS (left plot) and the EFS (right plot) of the two populations of NB patients predicted by the NB-hop classifier in the test cohort (n = 550) are shown. The classifier was built from the expression of NB-hop genes and patient outcome in the training set using the LibSVM library and leave one-out cross validation (LOOCV) technique. Blue and red curves represent the F and the UF classifications, respectively. Curves were compared by log-rank test. Log rank p value, number of patients classified by NB-hop (brackets), and number of deaths or events in each group of patients (square brackets) are reported. The number of patients at risk is displayed under the Kaplan–Meier plots. Each plot reports the hazard ratio (HR) and 95% of confidence interval (95% CI). (B) The NB-hop classifier prediction performances, measured by accuracy, sensitivity, precision, specificity, NPV, and MCC are shown. A brief description of the performance measures and the confusion matrix appear under the table. OS: Overall survival; EFS: Event-free survival; F: Favorable; UF: Unfavorable; HR: hazard ratio; CI: confidence interval; NPV: negative predictive value; MCC: Matthew’s correlation coefficient.

