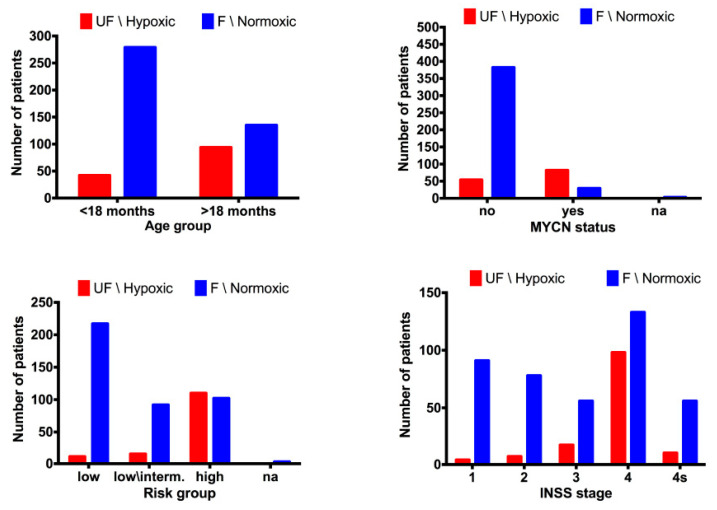
Figure 4.
Bar plots of the distribution of NB-hop predictions in the batch-adjusted test set. The bar plots shows the number of patients with unfavorable prognosis (UF) NB-hop (red) and F NB-hop (blue) on the y-axis and one of the reference variables (age at diagnosis, INSS stage, MYCN status, and risk group) on the x-axis. Age at diagnosis was split into two groups, one >18 months and the other <18 months. Risk group was divided into low, low/intermediate, and high risk on the basis of International NB risk group (INRG) pre-treatment risk stratification schema. Na stands for not accessible value. NB-hop prediction labels are displayed on top of each bar plot.

