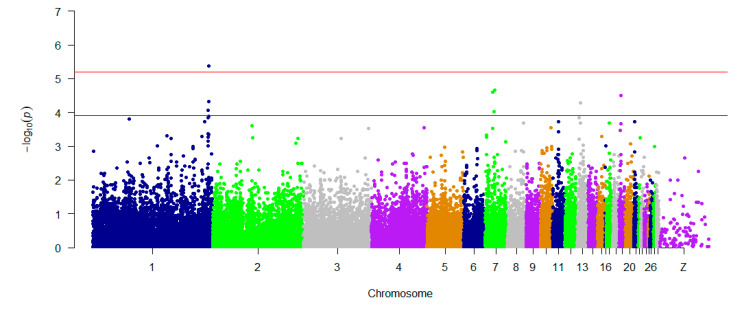
Figure 4.
Manhattan plots showing association of all SNPs with the H/L trait, by using GAPIT 3.0. SNPs are plotted on the x-axis according to their positions on each chromosome, and their association with H/L is shown on the y-axis (as -log10 (p-value)). The blue dashed line indicates suggestive genome-wide significance (p-value = 1.24 × 10⁻⁴), and the red line shows genome-wide 5% significance with a p-value threshold of 6.80 × 10⁻⁶.

