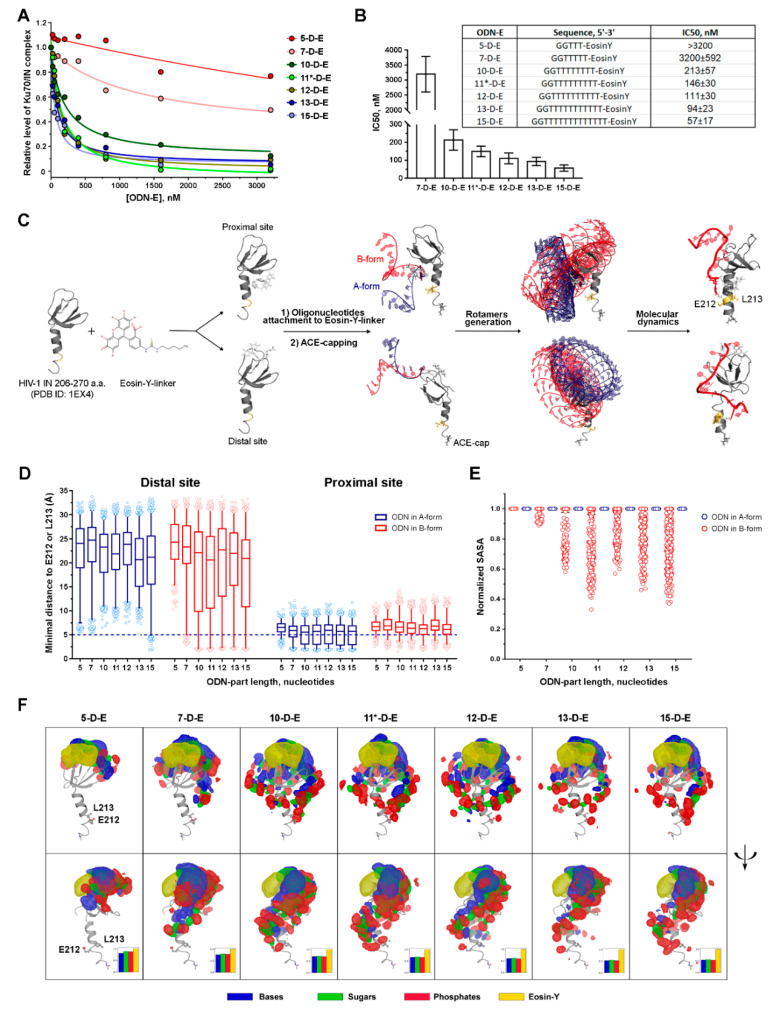
Figure 3.
An effect of the oligodeoxynucleotide length of ODN-E on the complex formation between the Ku70 and HIV-1 integrase. (A) Fluorescent pull-down assay analysis of the interaction of His6-Ku70-tRFP (200 nM) and GST-mCer-IN (200 nM) in presence of an increasing concentration of ODN-E with different size of ODN part (5–15 nucleotides). (B) ODN-E sequences and IC50 values measured in a fluorescent pull-down assay. (C) The pipeline of the molecular dynamics experiments for IN/ODN-E systems. Eosin-Y+linker was docked to the HIV-1 IN (PDB ID 1EX4, residues 206–270) and two complexes with Eosin-Y+linker bound at proximal and distal sites were obtained. After that, DNA oligonucleotides in either A or B forms were attached to the Eosin-Y+linker. To prevent the undesirable interactions between ODN-E and N-terminal charged amino group ACE-cap (acetyl group) was added to the N-terminus. The molecular dynamics simulations were carried out after the rotamers generation as described in the Materials and Methods section. (D) Distribution of minimal distances between atoms of the ODN-E and the E212/L213 residues of IN for different starting systems: eosin-Y bound at a proximal or distal site in C-terminal domain of IN, A- or B-ODN forms. (E) Distribution of normalized solvent-accessible surface area (SASA) of E212/L213 in complexes of HIV-1 IN with ODN-E obtained in the molecular dynamics simulations for starting systems with eosin-Y bound at the distal site and ODN in A- or B-form. (F) Density maps of the ODN-E. Atom positions belonging to the particular fragments (eosin-Y, sugars, phosphates, bases) were averaged across all oligonucleotide structures and depicted with meshes at the 3σ level. Atoms, including hydrogens, were treated as spheres with the vdW radius of corresponding chemical elements. Phosphates are colored in red, sugars in green, bases in blue, and eosin-Y in gold.

