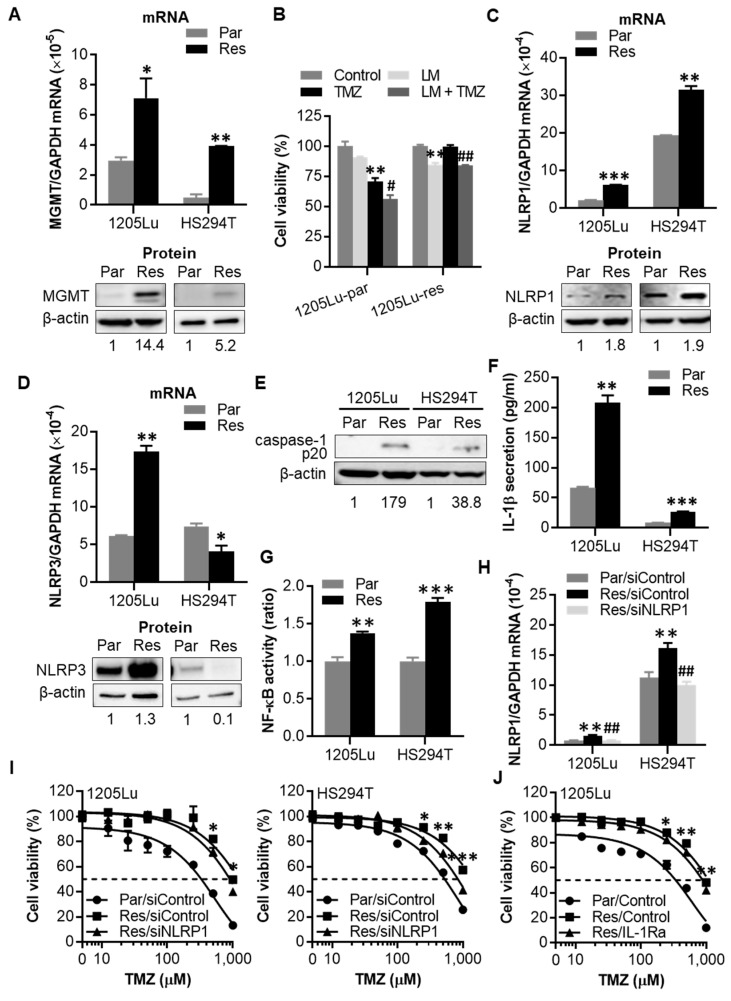
Figure 4.
TMZ-resistant cells show increased NLRP1 expression and IL-1β secretion levels. Resistant 1205Lu and HS294T cells were generated after exposing cells to stepwise increasing doses of TMZ (50–200 μM for 1205Lu and 25–100 μΜ for HS294T) over two months. (A) qRT-PCR analysis of MGMT mRNA expression (upper panel) and Western blot analysis of MGMT protein expression (lower panel) in resistant cells. (B) Cell viability of 1205Lu parental and resistant cells evaluated by MTS assay after the treatment with a single dose of TMZ and/or a single dose of the MGMT inhibitor Lomeguatrib (LM) for 72 h. (C) NLRP1 mRNA (upper panel) and protein (lower panel) expression, (D) NLRP3 mRNA (upper panel) and protein (lower panel) expression, (E) caspase-1 cleavage, (F) IL-1β secretion, and (G) NF-κB activity of resistant 1205Lu and HS294T cells. (H) NLRP1 mRNA expression in parental and resistant 1205Lu and HS294T cells at 24 h after transfection with siNLRP1. (I) Cell viability of parental and resistant 1205Lu (left) and HS294T (right) cells after NLRP1 knockdown for 18 h and then TMZ treatment for 72 h. (J) Cell viability of resistant 1205Lu cells after daily treatment with IL-1Ra (10 μg/mL) for 72 h. Parental and resistant cells are indicated by “Par” and “Res”, respectively. In (I,J), dashed lines indicate the 50% inhibitory concentrations (IC50) of TMZ. Data are representative of three independent experiments, and are expressed as the mean ± SEM (n = 3-4). * p < 0.05, ** p < 0.01, and *** p < 0.001 vs the corresponding parental cells (A),(C),(D),(F),(G), the corresponding control cells (B), the Res/siControl cells (I), or the Res/Control cells (J). # p < 0.05 and ## p < 0.01 vs the TMZ alone cells (B) or the Res/siControl cells (H).

